Back to all Blog Posts

Food for Regression: Using Sales Data to Identify Price Elasticity

  • Data Science
  • R
  • Statistics & Methods
09. July 2018
·

Daniel Lüttgau
Head of AI Development

A few hundred meters from our office, there is a little lunch place. It is part of a small chain that specializes in assemble-yourself, ready-to-eat salads. When we moved into our new office a few years ago, this salad vendor quickly became a daily fixture. However, overtime, this changed. We still eat there regularly, but I am certain, if one were to look at their statworx - related turnover the trend would not delight management and the question is why?
The answer has a lot to do with the arrival of new competitors, improved cooking skills, elaborate promotions and certainly also pricing. It is the latter - pricing - that will be at the center of this series.

When analyzing pricing related issues, it is often of essential interest to have a measure of how some change in price affects demand. The measure generally agreed upon by economists to describe this relationship is that of price elasticity of demand, $epsilon$. As a relative measure, it is unit independent, which turns it into a winner. Elasticity is defined as the percent change in quantity divided by percentage change in price:

$$\epsilon = \frac{qty/\Delta qty}{price/\Delta price}$$

Conceptually, three conditions are commonly distinguished: elasticity scores of $ \lt -1 $ indicate an 'elastic demand.' This means that if one increases the price by one percent, the quantity of demand decreases by more than one percent. The other two conditions are elasticities of demand $ \gt -1 $, in which case we speak of 'inelastic demand' and the case when elasticity equals $-1$. This is called 'unit elastic demand.'

Being able to deduce the actual price elasticity of demand for our salad bar would be of great help. With a reliable elastic score at hand, we can answer questions like: How many salads can we expect to sell at a given price? How does a price change of 10% affect demand? With this knowledge, it would be possible to utilize one's pricing as a tool in order to target different salad-business KPIs. Eventually, the salad bar can adjust its price in order to maximize profit or to increase sales - depending on their strategic objectives.

It is the intricacies of deriving these price elasticities of demand with regressions that will be the subject of this short blog. The situation of our salad vendor makes for an illustrative case on how we can calculate price elasticity and how they can be used to adjust one's pricing strategy.

Setup

To be upfront - although this salad vendor exists, and it is in fact an integral part in the STATWORX food chain - all the data we work with is made up. It describes, how I imagine this little salad vendor's market situation to be. With each new post, as we examine more complex issues, we will delve deeper into the intricacies of the salad vendor's world.

The question of this blog post is simple: How can we use linear regression to derive price elasticities? To explore this, we need historic prices and sales information. To begin, there will be no consideration of competition, no in-store alternatives, no new promotional activates, no seasonal-effects, or anything else.

Daily sales prices of the past two years were simulated for our little salad bar by randomly selecting prices between 5.59€ and 9.99€ - clearly not a great pricing strategy, but it suffices for this post's purposes. A multiplicative demand function was used to derive sales with some randomness added. And with that we are done simulating the data. For more details, check out the code at our Githubpage.

Calculating Elasticity of Demand

We want to know how a linear regression function relates to elasticity. It turns out that this depends on how the variables have been transformed. It is possible to deduce elasticity - a factor of relative change - in almost any situation. Here you find the four most common transformations.

Transformation Function Elasticity
Level-Level $ Y = a + bX $ $ \epsilon = b \cdot \frac{X}{Y} $
Log-Level $ \ln(Y) = a + bX $ $ \epsilon = b \cdot X $
Level-Log $ Y = a + b \cdot \ln(X) $ $ \epsilon = \frac{b}{Y} $
Log-Log $ \ln(Y) = a + b \cdot \ln(X) $ $ \epsilon = b $

Dependent on the pre-regression variable transformation, different post-regression transformations are necessary in order to derive the elasticity scores. The table above shows that in the case of a log-log model, the elasticity is a constant value across the entire demand curve; while in all other cases, it is dependent on the specific current price and/or demand. This means that the choice of the model is indicative of the assumed demand curve. Choosing wrongly results in a misspecified model.

This is great to know, but which model should one use? To evaluate this, I simply ran each of these four models. The results you can find in the table below, but they are nothing like you will ever find in the real world, in that all effects are highly significant and the $R^2$ is ridiculously high for any social or economic analysis. This is by design as hardly any randomness was added. In addition, the data was setup up in a way that the log-log model was predestined to generate the winning model.

Model Intercept Price Variable $ \bar{\epsilon} $ Elasticity $ R^2 $
Level-Level $ 439.58 \left( 3.2 \right) $ $ -38.57 \left( 0.42 \right) $ $ -2.50 $ $ 0.84 $
Log-Level $ 6.59 \left( 0.01 \right) $ $ -0.23 \left( 0.01 \right) $ $ -1.63 $ $ 0.95 $
Level-Log $ 671.22 \left( 3.53 \right) $ $ -265.66 \left( 1.83 \right) $ $ -2.11 $ $ 0.93 $
Log-Log $ 7.86 \left( 0.01 \right) $ $ -1.52 \left( 0.01 \right) $ $ -1.51 $ $ 0.97 $

The argument is not that a log-log model is the best model to derive elasticities. Although, there are strong microeconomics arguments to be made about why the log-log model is the most reasonable model to describe demand elasticity. The underlying demand curve describes demand most like economists assume it to behave. It ensures that demand cannot sink below zero as the price increases and on the other side demand exponentially grows as the price decreases. Yet, the deductibility of a constant elasticity value, as aforementioned, is its most desirable feature. This fact makes it much easier to apply elasticity to optimize pricing.

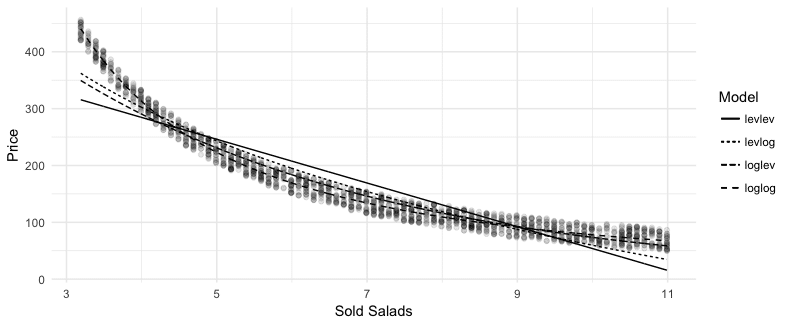
Still, empirical analysis might guide us to assume other price-demand relationships. The graphic below shows this in an illustrative way. The legend of the graph orders the models in increasing order of fit. Looking at each graph, it becomes clear why the level-log model fares better than the level-level model, and why the log-level model outperforms the level-log model and so on. The non-linear relationship between price and demand that we introduced by relying a multiplicative demand curve is best described by the log-log model. Had I used an additive demand curve the ranking would have been the other way around. Thus, the argument is that under certain circumstances the model choice can have a significant impact.

elasticity regression comp

For the application in practice we have to be very aware of the functional form that is indicated by the regression we chose. The effects can have severe consequences. The elasticity with which the data was generated was -1.5. In order to illustrate the effect that model choice can have on the estimated elasticity, I calculated average elasticities for level-level, log-level and level-level models and compared it with the price coefficient of the log-log model. This is a bit of an oversimplification, but the point still stands: The results are substantially different, which has consequences when one tries to utilize the deducted elasticities. Yet, based on the graphical analysis and the model information, we would come to the conclusion that the log-log fares best, so we can proceed as theory would want us to.

Price Optimalization

Before we finish, let's quickly look at how we can use elasticity to improve the little salad vendor's erratic pricing strategy (my random daily price change). For this we need to know the salad bar's cost function. Luckily, we do: it has fix costs of about 300€ for every day it is open. The preparation of a single salad costs about 2.50€ per salad. The cost function is thus:

$$€€TotalCost = 300 € + SaladesSold * 2.50 €$$

Microeconomic theory teaches us that fix costs do not matter when calculating elasticity-based margin optimized prices. I'll spare you the details, but the function to calculate the optimized price eventually states:

$$OptimalPrice = \frac{Elasticity*CostPerSalad}{1+Elasticity}$$

Applying the elasticity derived from the log-log model, this results in a proposed optimized price that lies somewhere between 7.21€ and 7.47€. The estimation is 7.34€. Instead of daily changing its price randomly, it is best to stick to prices in this range. The salad vendor can expect to sell around 125 Salads each day, ensuring a daily profit of between 287€ and 320€.

KPIs Lowerbound Elasticity Exp. Elasticity Upperbound Elasticity
Elasticity -1.51 -1.52 -1.54
Opt. Price 7.43€ 7.30€ 7.17€
Quantity 126 125 125
Profit 319€ 302€ 285€

This is a daring statement. With the actual example data the conclusion would be fine. But in practice such perfect regression results, with so little uncertainty, are unrealistic. And this is where it tends to get tricky. To illustrate this point, I adjusted the standard error from almost nonexistent to 0.15. The results should still be highly significant, but looking at the table below one would be surprised about the consequences of such small changes.

KPIs Lowerbound Elasticity Exp. Elasticity Upperbound Elasticity
Elasticity -1.23 -1.52 -1.82
Opt. Price 13.51€ 7.30€ 5.57€
Quantity 106 125 114
Profit 864€ 302€ 51€

The certainty with which we proposed the optimal price was very much unfounded. In this example, the range for elasticity still is relatively small despite the increased uncertainty. Yet, the resulting price range for the ideal price is between 5.58€ and 13.73€, which is not a very precise proposal. The price range actually exceeds the highest price that the little salad vendor ever dared to set. The consequences are severe: the resulting profit varies almost sixteen-fold between the highest and lowest prices.

To state the obvious, the illustrated approach to elasticity calculations is just the tip of the iceberg. Meaning that we need to invest time into improving the current approach. The next posts will focus on intervening factors like promotional activities and similar products.

Linkedin Logo
Marcel Plaschke
Head of Strategy, Sales & Marketing
schedule a consultation
Zugehörige Leistungen
No items found.

More Blog Posts

  • Artificial Intelligence
AI Trends Report 2025: All 16 Trends at a Glance
Tarik Ashry
05. February 2025
Read more
  • Artificial Intelligence
  • Data Science
  • Human-centered AI
Explainable AI in practice: Finding the right method to open the Black Box
Jonas Wacker
15. November 2024
Read more
  • Artificial Intelligence
  • Data Science
  • GenAI
How a CustomGPT Enhances Efficiency and Creativity at hagebau
Tarik Ashry
06. November 2024
Read more
  • Artificial Intelligence
  • Data Culture
  • Data Science
  • Deep Learning
  • GenAI
  • Machine Learning
AI Trends Report 2024: statworx COO Fabian Müller Takes Stock
Tarik Ashry
05. September 2024
Read more
  • Artificial Intelligence
  • Human-centered AI
  • Strategy
The AI Act is here – These are the risk classes you should know
Fabian Müller
05. August 2024
Read more
  • Artificial Intelligence
  • GenAI
  • statworx
Back to the Future: The Story of Generative AI (Episode 4)
Tarik Ashry
31. July 2024
Read more
  • Artificial Intelligence
  • GenAI
  • statworx
Back to the Future: The Story of Generative AI (Episode 3)
Tarik Ashry
24. July 2024
Read more
  • Artificial Intelligence
  • GenAI
  • statworx
Back to the Future: The Story of Generative AI (Episode 2)
Tarik Ashry
04. July 2024
Read more
  • Artificial Intelligence
  • GenAI
  • statworx
Back to the Future: The Story of Generative AI (Episode 1)
Tarik Ashry
10. July 2024
Read more
  • Artificial Intelligence
  • GenAI
  • statworx
Generative AI as a Thinking Machine? A Media Theory Perspective
Tarik Ashry
13. June 2024
Read more
  • Artificial Intelligence
  • GenAI
  • statworx
Custom AI Chatbots: Combining Strong Performance and Rapid Integration
Tarik Ashry
10. April 2024
Read more
  • Artificial Intelligence
  • Data Culture
  • Human-centered AI
How managers can strengthen the data culture in the company
Tarik Ashry
21. February 2024
Read more
  • Artificial Intelligence
  • Data Culture
  • Human-centered AI
AI in the Workplace: How We Turn Skepticism into Confidence
Tarik Ashry
08. February 2024
Read more
  • Artificial Intelligence
  • Data Science
  • GenAI
The Future of Customer Service: Generative AI as a Success Factor
Tarik Ashry
25. October 2023
Read more
  • Artificial Intelligence
  • Data Science
How we developed a chatbot with real knowledge for Microsoft
Isabel Hermes
27. September 2023
Read more
  • Data Science
  • Data Visualization
  • Frontend Solution
Why Frontend Development is Useful in Data Science Applications
Jakob Gepp
30. August 2023
Read more
  • Artificial Intelligence
  • Human-centered AI
  • statworx
the byte - How We Built an AI-Powered Pop-Up Restaurant
Sebastian Heinz
14. June 2023
Read more
  • Artificial Intelligence
  • Recap
  • statworx
Big Data & AI World 2023 Recap
Team statworx
24. May 2023
Read more
  • Data Science
  • Human-centered AI
  • Statistics & Methods
Unlocking the Black Box – 3 Explainable AI Methods to Prepare for the AI Act
Team statworx
17. May 2023
Read more
  • Artificial Intelligence
  • Human-centered AI
  • Strategy
How the AI Act will change the AI industry: Everything you need to know about it now
Team statworx
11. May 2023
Read more
  • Artificial Intelligence
  • Human-centered AI
  • Machine Learning
Gender Representation in AI – Part 2: Automating the Generation of Gender-Neutral Versions of Face Images
Team statworx
03. May 2023
Read more
  • Artificial Intelligence
  • Data Science
  • Statistics & Methods
A first look into our Forecasting Recommender Tool
Team statworx
26. April 2023
Read more
  • Artificial Intelligence
  • Data Science
On Can, Do, and Want – Why Data Culture and Death Metal have a lot in common
David Schlepps
19. April 2023
Read more
  • Artificial Intelligence
  • Human-centered AI
  • Machine Learning
GPT-4 - A categorisation of the most important innovations
Mareike Flögel
17. March 2023
Read more
  • Artificial Intelligence
  • Data Science
  • Strategy
Decoding the secret of Data Culture: These factors truly influence the culture and success of businesses
Team statworx
16. March 2023
Read more
  • Artificial Intelligence
  • Deep Learning
  • Machine Learning
How to create AI-generated avatars using Stable Diffusion and Textual Inversion
Team statworx
08. March 2023
Read more
  • Artificial Intelligence
  • Human-centered AI
  • Strategy
Knowledge Management with NLP: How to easily process emails with AI
Team statworx
02. March 2023
Read more
  • Artificial Intelligence
  • Deep Learning
  • Machine Learning
3 specific use cases of how ChatGPT will revolutionize communication in companies
Ingo Marquart
16. February 2023
Read more
  • Recap
  • statworx
Ho ho ho – Christmas Kitchen Party
Julius Heinz
22. December 2022
Read more
  • Artificial Intelligence
  • Deep Learning
  • Machine Learning
Real-Time Computer Vision: Face Recognition with a Robot
Sarah Sester
30. November 2022
Read more
  • Data Engineering
  • Tutorial
Data Engineering – From Zero to Hero
Thomas Alcock
23. November 2022
Read more
  • Recap
  • statworx
statworx @ UXDX Conf 2022
Markus Berroth
18. November 2022
Read more
  • Artificial Intelligence
  • Machine Learning
  • Tutorial
Paradigm Shift in NLP: 5 Approaches to Write Better Prompts
Team statworx
26. October 2022
Read more
  • Recap
  • statworx
statworx @ vuejs.de Conf 2022
Jakob Gepp
14. October 2022
Read more
  • Data Engineering
  • Data Science
Application and Infrastructure Monitoring and Logging: metrics and (event) logs
Team statworx
29. September 2022
Read more
  • Coding
  • Data Science
  • Machine Learning
Zero-Shot Text Classification
Fabian Müller
29. September 2022
Read more
  • Cloud Technology
  • Data Engineering
  • Data Science
How to Get Your Data Science Project Ready for the Cloud
Alexander Broska
14. September 2022
Read more
  • Artificial Intelligence
  • Human-centered AI
  • Machine Learning
Gender Repre­sentation in AI – Part 1: Utilizing StyleGAN to Explore Gender Directions in Face Image Editing
Isabel Hermes
18. August 2022
Read more
  • Artificial Intelligence
  • Human-centered AI
statworx AI Principles: Why We Started Developing Our Own AI Guidelines
Team statworx
04. August 2022
Read more
  • Data Engineering
  • Data Science
  • Python
How to Scan Your Code and Dependencies in Python
Thomas Alcock
21. July 2022
Read more
  • Data Engineering
  • Data Science
  • Machine Learning
Data-Centric AI: From Model-First to Data-First AI Processes
Team statworx
13. July 2022
Read more
  • Artificial Intelligence
  • Deep Learning
  • Human-centered AI
  • Machine Learning
DALL-E 2: Why Discrimination in AI Development Cannot Be Ignored
Team statworx
28. June 2022
Read more
  • R
The helfRlein package – A collection of useful functions
Jakob Gepp
23. June 2022
Read more
  • Recap
  • statworx
Unfold 2022 in Bern – by Cleverclip
Team statworx
11. May 2022
Read more
  • Artificial Intelligence
  • Data Science
  • Human-centered AI
  • Machine Learning
Break the Bias in AI
Team statworx
08. March 2022
Read more
  • Artificial Intelligence
  • Cloud Technology
  • Data Science
  • Sustainable AI
How to Reduce the AI Carbon Footprint as a Data Scientist
Team statworx
02. February 2022
Read more
  • Recap
  • statworx
2022 and the rise of statworx next
Sebastian Heinz
06. January 2022
Read more
  • Recap
  • statworx
5 highlights from the Zurich Digital Festival 2021
Team statworx
25. November 2021
Read more
  • Data Science
  • Human-centered AI
  • Machine Learning
  • Strategy
Why Data Science and AI Initiatives Fail – A Reflection on Non-Technical Factors
Team statworx
22. September 2021
Read more
  • Artificial Intelligence
  • Data Science
  • Human-centered AI
  • Machine Learning
  • statworx
Column: Human and machine side by side
Sebastian Heinz
03. September 2021
Read more
  • Coding
  • Data Science
  • Python
How to Automatically Create Project Graphs With Call Graph
Team statworx
25. August 2021
Read more
  • Coding
  • Python
  • Tutorial
statworx Cheatsheets – Python Basics Cheatsheet for Data Science
Team statworx
13. August 2021
Read more
  • Data Science
  • statworx
  • Strategy
STATWORX meets DHBW – Data Science Real-World Use Cases
Team statworx
04. August 2021
Read more
  • Data Engineering
  • Data Science
  • Machine Learning
Deploy and Scale Machine Learning Models with Kubernetes
Team statworx
29. July 2021
Read more
  • Cloud Technology
  • Data Engineering
  • Machine Learning
3 Scenarios for Deploying Machine Learning Workflows Using MLflow
Team statworx
30. June 2021
Read more
  • Artificial Intelligence
  • Deep Learning
  • Machine Learning
Car Model Classification III: Explainability of Deep Learning Models With Grad-CAM
Team statworx
19. May 2021
Read more
  • Artificial Intelligence
  • Coding
  • Deep Learning
Car Model Classification II: Deploying TensorFlow Models in Docker Using TensorFlow Serving
No items found.
12. May 2021
Read more
  • Coding
  • Deep Learning
Car Model Classification I: Transfer Learning with ResNet
Team statworx
05. May 2021
Read more
  • Artificial Intelligence
  • Deep Learning
  • Machine Learning
Car Model Classification IV: Integrating Deep Learning Models With Dash
Dominique Lade
05. May 2021
Read more
  • AI Act
Potential Not Yet Fully Tapped – A Commentary on the EU’s Proposed AI Regulation
Team statworx
28. April 2021
Read more
  • Artificial Intelligence
  • Deep Learning
  • statworx
Creaition – revolutionizing the design process with machine learning
Team statworx
31. March 2021
Read more
  • Artificial Intelligence
  • Data Science
  • Machine Learning
5 Types of Machine Learning Algorithms With Use Cases
Team statworx
24. March 2021
Read more
  • Recaps
  • statworx
2020 – A Year in Review for Me and GPT-3
Sebastian Heinz
23. Dezember 2020
Read more
  • Artificial Intelligence
  • Deep Learning
  • Machine Learning
5 Practical Examples of NLP Use Cases
Team statworx
12. November 2020
Read more
  • Data Science
  • Deep Learning
The 5 Most Important Use Cases for Computer Vision
Team statworx
11. November 2020
Read more
  • Data Science
  • Deep Learning
New Trends in Natural Language Processing – How NLP Becomes Suitable for the Mass-Market
Dominique Lade
29. October 2020
Read more
  • Data Engineering
5 Technologies That Every Data Engineer Should Know
Team statworx
22. October 2020
Read more
  • Artificial Intelligence
  • Data Science
  • Machine Learning

Generative Adversarial Networks: How Data Can Be Generated With Neural Networks
Team statworx
10. October 2020
Read more
  • Coding
  • Data Science
  • Deep Learning
Fine-tuning Tesseract OCR for German Invoices
Team statworx
08. October 2020
Read more
  • Artificial Intelligence
  • Machine Learning
Whitepaper: A Maturity Model for Artificial Intelligence
Team statworx
06. October 2020
Read more
  • Data Engineering
  • Data Science
  • Machine Learning
How to Provide Machine Learning Models With the Help Of Docker Containers
Thomas Alcock
01. October 2020
Read more
  • Recap
  • statworx
STATWORX 2.0 – Opening of the New Headquarters in Frankfurt
Julius Heinz
24. September 2020
Read more
  • Machine Learning
  • Python
  • Tutorial
How to Build a Machine Learning API with Python and Flask
Team statworx
29. July 2020
Read more
  • Data Science
  • Statistics & Methods
Model Regularization – The Bayesian Way
Thomas Alcock
15. July 2020
Read more
  • Recap
  • statworx
Off To New Adventures: STATWORX Office Soft Opening
Team statworx
14. July 2020
Read more
  • Data Engineering
  • R
  • Tutorial
How To Dockerize ShinyApps
Team statworx
15. May 2020
Read more
  • Coding
  • Python
Making Of: A Free API For COVID-19 Data
Sebastian Heinz
01. April 2020
Read more
  • Frontend
  • Python
  • Tutorial
How To Build A Dashboard In Python – Plotly Dash Step-by-Step Tutorial
Alexander Blaufuss
26. March 2020
Read more
  • Coding
  • R
Why Is It Called That Way?! – Origin and Meaning of R Package Names
Team statworx
19. March 2020
Read more
  • Data Visualization
  • R
Community Detection with Louvain and Infomap
Team statworx
04. March 2020
Read more
  • Coding
  • Data Engineering
  • Data Science
Testing REST APIs With Newman
Team statworx
26. February 2020
Read more
  • Coding
  • Frontend
  • R
Dynamic UI Elements in Shiny – Part 2
Team statworx
19. Febuary 2020
Read more
  • Coding
  • Data Visualization
  • R
Animated Plots using ggplot and gganimate
Team statworx
14. Febuary 2020
Read more
  • Machine Learning
Machine Learning Goes Causal II: Meet the Random Forest’s Causal Brother
Team statworx
05. February 2020
Read more
  • Artificial Intelligence
  • Machine Learning
  • Statistics & Methods
Machine Learning Goes Causal I: Why Causality Matters
Team statworx
29.01.2020
Read more
  • Data Engineering
  • R
  • Tutorial
How To Create REST APIs With R Plumber
Stephan Emmer
23. January 2020
Read more
  • Recaps
  • statworx
statworx 2019 – A Year in Review
Sebastian Heinz
20. Dezember 2019
Read more
  • Artificial Intelligence
  • Deep Learning
Deep Learning Overview and Getting Started
Team statworx
04. December 2019
Read more
  • Coding
  • Machine Learning
  • R
Tuning Random Forest on Time Series Data
Team statworx
21. November 2019
Read more
  • Data Science
  • R
Combining Price Elasticities and Sales Forecastings for Sales Improvement
Team statworx
06. November 2019
Read more
  • Data Engineering
  • Python
Access your Spark Cluster from Everywhere with Apache Livy
Team statworx
30. October 2019
Read more
  • Recap
  • statworx
STATWORX on Tour: Wine, Castles & Hiking!
Team statworx
18. October 2019
Read more
  • Data Science
  • R
  • Statistics & Methods
Evaluating Model Performance by Building Cross-Validation from Scratch
Team statworx
02. October 2019
Read more
  • Data Science
  • Machine Learning
  • R
Time Series Forecasting With Random Forest
Team statworx
25. September 2019
Read more
  • Coding
  • Frontend
  • R
Dynamic UI Elements in Shiny – Part 1
Team statworx
11. September 2019
Read more
  • Machine Learning
  • R
  • Statistics & Methods
What the Mape Is FALSELY Blamed For, Its TRUE Weaknesses and BETTER Alternatives!
Team statworx
16. August 2019
Read more
  • Coding
  • Python
Web Scraping 101 in Python with Requests & BeautifulSoup
Team statworx
31. July 2019
Read more
  • Coding
  • Frontend
  • R
Getting Started With Flexdashboards in R
Thomas Alcock
19. July 2019
Read more
  • Recap
  • statworx
statworx summer barbecue 2019
Team statworx
21. June 2019
Read more
  • Data Visualization
  • R
Interactive Network Visualization with R
Team statworx
12. June 2019
Read more
No items found.
This is some text inside of a div block.