Back to all Blog Posts

How to Automatically Create Project Graphs With Call Graph

  • Coding
  • Data Science
  • Python
25. August 2021
·

Team statworx

Introduction

The more complex any given data science project in Python gets, the harder it usually becomes to keep track of how all modules interact with each other. Undoubtedly, when working in a team on a bigger project, as is often the case here at STATWORX, the codebase can soon grow to an extent where the complexity may seem daunting. In a typical scenario, each team member works in their “corner” of the project, leaving each one merely with firm local knowledge of the project’s code but possibly only a vague idea of the overall project architecture. Ideally, however, everyone involved in the project should have a good global overview of the project. By that, I don’t mean that one has to know how each function works internally but rather to know the responsibility of the main modules and how they are interconnected.

A visual helper for learning about the global structure can be a call graph. A call graph is a directed graph that displays which function calls which. It is created from the data of a Python profiler such as cProfile.

Since such a graph proved helpful in a project I’m working on, I created a package called project_graph, which builds such a call graph for any provided python script. The package creates a profile of the given script via cProfile, converts it into a filtered dot graph via gprof2dot, and finally exports it as a .png file.

Why Are Project Graphs Useful?

As a small first example, consider this simple module.

# test_script.py

import time
from tests.goodnight import sleep_five_seconds

def sleep_one_seconds():
    time.sleep(1)

def sleep_two_seconds():
    time.sleep(2)

for i in range(3):
    sleep_one_seconds()

sleep_two_seconds()

sleep_five_seconds()

After installation (see below), by writing project_graph test_script.py into the command line, the following png-file is placed next to the script:

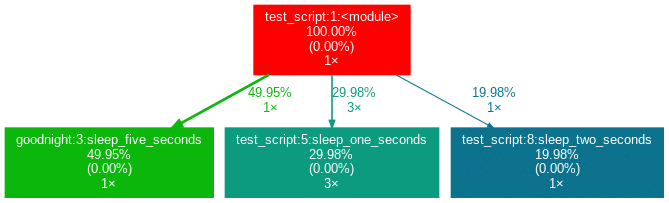
The script to be profiled always acts as a starting point and is the root of the tree. Each box is captioned with a function’s name, the overall percentage of time spent in the function, and its number of calls. The number in brackets represents the time spent in the function’s code, excluding time spent in other functions that are called in it.

In this case, all time is spent in the external module time‘s function sleep, which is why the number is 0.00%. Rarely a lot of time is spent in self-written functions, as the workload of a script usually quickly trickles down to very low-level functions of the Python implementation itself. Also, next to the arrows is the amount of time that one function passes to the other, along with the number of calls. The colors (RED-GREEN-BLUE, descending) and the thickness of the arrows indicate the relevance of different spots in the program.

Note that the percentages of the three functions above don’t add up to 100%. The reason behind is is that the graph is set up to only include self-written functions. In this case, the importing the time module caused the Python interpreter to spend 0.04% time in a function of the module importlib.

Evaluation with External Packages

Consider a second example:

# test_script_2.py

import pandas as pd
from tests.goodnight import sleep_five_seconds

# some random madness
for i in range(1000):
   a_frame = pd.DataFrame([[1,2,3]])

sleep_five_seconds()

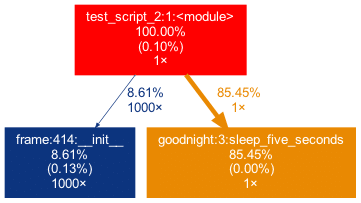
capture this in the graph, we can add the external package (pandas) with the -x flag. However, initializing a Pandas DataFrame is done within many pandas-internal functions. Frankly, I am personally not interested in the inner convolutions of pandas which is why I want the tree to not “sprout” too deep into the pandas mechanics. This can be accounted for by allowing only functions to show up if a minimal percentage of the runtime is spent in them.

Exactly this can be done using the -mflag. In combination, project_graph -m 8 -x pandas test_script_2.py yields the following:

Toy examples aside, let’s move on to something more serious. A real-life data-science project could look like this one:

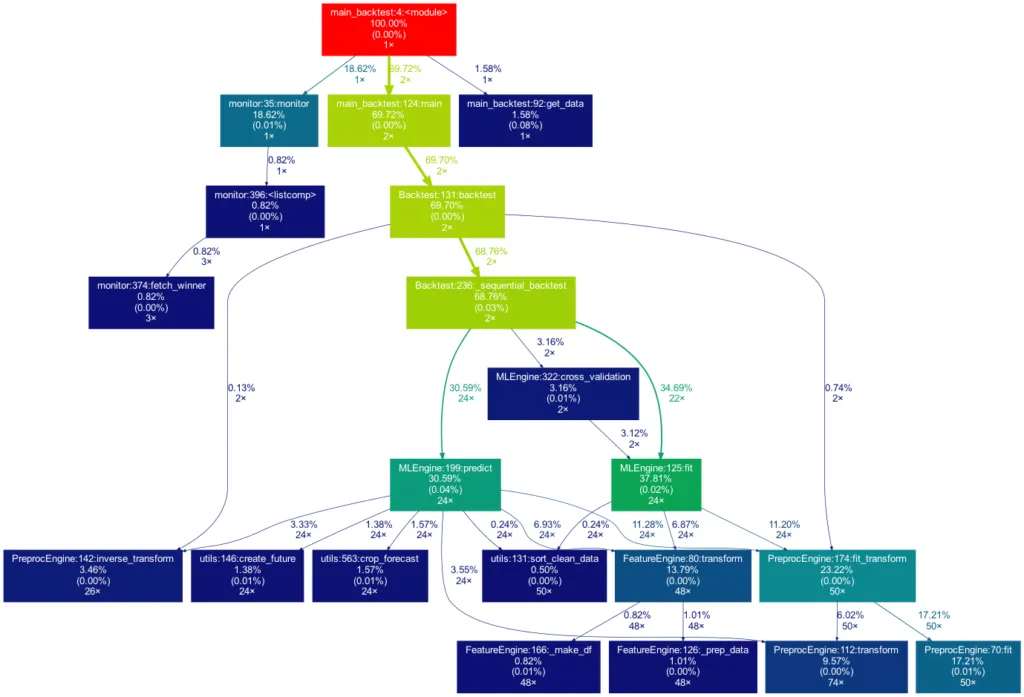
This time the tree is much bigger. It is actually even bigger than what you see in the illustration, as many more self-written functions are invoked. However, they are trimmed from the tree for clarity, as functions in which less than 0.5 % of the overall time is spent are filtered out (this is the default setting for the -m flag). Note that such a graph also really shines when searching for performance bottlenecks. One can see right away which functions carry most of the workload, when they are called, and how often they are called. This may prevent you from optimizing your program in the wrong spots while ignoring the elephant in the room.

How to Use Project Graphs

Installation

Within your project’s environment, do the following:

brew install graphviz

pip install git+https://github.com/fior-di-latte/project_graph.git


Usage

Within your project’s environment, change your current working directory to the project’s root (this is important!) and then enterfor standard usage:

project_graph myscript.py

If your script includes an argparser, use:

project_graph "myscript.py <arg1> <arg2> (...)"

If you want to see the entire graph, including all external packages, use:

project_graph -a myscript.py

If you want to use a visibility threshold other than 1%, use:

project_graph -m <percent_value> myscript.py

Finally, if you want to include external packages into the graph, you can specify them as follows:

project_graph -x <package1> -x <package2> (...) myscript.py


Conclusion & Caveats

This package has certain weaknesses, most of which can be addressed, e.g., by formatting the code into a function-based style, by trimming with the -m flag, or adding packages by using the -x flag. Generally, if something seems odd, the best first step is probably to use the -a flag to debug. Significant caveats are the following:

  • It only works on Unix systems.
  • It does not show a truthful graph when used with multiprocessing. The reason behind that is that cProfile is not compatible with multiprocessing. If multiprocessing is used, only the root process will be profiled, leading to false computation times in the graph. Switch to a non-parallel version of the target script.
  • Profiling a script can lead to a considerable overhead computation-wise. It can make sense to scale down the work done in your script (i.e., decrease the amount of input data). If so, the time spent in the functions, of course, can be distorted massively if the functions don’t scale linearly.
  • Nested functions will not show up in the graph. In particular, a decorator implicitly nests your function and will thus hide your function. That said, when using an external decorator, don’t forget to add the decorator’s package via the -x flag (for example, project_graph -x numba myscript.py).
  • If your self-written function is exclusively called from an external package’s function, you must manually add the external package with the -x flag. Otherwise, your function will not show up in the tree, as its parent is an external function and thus not considered.

Feel free to use the little package for your own project, be it for performance analysis, code introductions for new team members, or out of sheer curiosity. As for me, I find it very satisfying to see such a visualization of my projects. If you have trouble using it, don’t hesitate to hit me up on Github.

PS: If you’re looking for a similar package in R, check out Jakob’s post on flowcharts of functions.

Linkedin Logo
Marcel Plaschke
Head of Strategy, Sales & Marketing
schedule a consultation
Zugehörige Leistungen
No items found.

More Blog Posts

  • Coding
  • Data Science
  • Machine Learning
Zero-Shot Text Classification
Fabian Müller
17.4.2025
Read more
  • Coding
  • Python
Making Of: A Free API For COVID-19 Data
Sebastian Heinz
17.4.2025
Read more
  • Coding
  • Python
  • R
R and Python: Using Reticulate to Get the Best of Both Worlds
Team statworx
17.4.2025
Read more
  • Coding
  • Frontend
  • R
Getting Started With Flexdashboards in R
Thomas Alcock
17.4.2025
Read more
  • Artificial Intelligence
  • Machine Learning
  • Statistics & Methods
Machine Learning Goes Causal I: Why Causality Matters
Team statworx
17.4.2025
Read more
  • Coding
  • Data Visualization
  • R
Coordinate Systems in ggplot2: Easily Overlooked and Rather Underrated
Team statworx
17.4.2025
Read more
  • Data Engineering
  • R
  • Tutorial
How To Create REST APIs With R Plumber
Stephan Emmer
17.4.2025
Read more
  • Coding
  • Frontend
  • R
Dynamic UI Elements in Shiny – Part 1
Team statworx
17.4.2025
Read more
  • Recaps
  • statworx
statworx 2019 – A Year in Review
Sebastian Heinz
17.4.2025
Read more
  • Recap
  • statworx
STATWORX on Tour: Wine, Castles & Hiking!
Team statworx
17.4.2025
Read more
  • Recap
  • statworx
Off To New Adventures: STATWORX Office Soft Opening
Team statworx
17.4.2025
Read more
  • Recap
  • statworx
STATWORX on Tour: Year-End-Event in Belgium
Sebastian Heinz
17.4.2025
Read more
  • Recap
  • statworx
statworx summer barbecue 2019
Team statworx
17.4.2025
Read more
  • Coding
  • R
  • Tutorial
Compiling R Code in Sublime Text
Team statworx
17.4.2025
Read more
  • Coding
  • R
  • Tutorial
Make RStudio Look the Way You Want — Because Beauty Matters
Team statworx
17.4.2025
Read more
  • Recaps
  • statworx
2020 – A Year in Review for Me and GPT-3
Sebastian Heinz
17.4.2025
Read more
  • Coding
  • R
Master R shiny: One trick to build maintainable and scaleable event chains
Team statworx
17.4.2025
Read more
  • Coding
  • Python
  • Statistics & Methods
Ensemble Methods in Machine Learning: Bagging & Subagging
Team statworx
15.4.2025
Read more
  • Deep Learning
  • Python
  • Tutorial
Using Reinforcement Learning to play Super Mario Bros on NES using TensorFlow
Sebastian Heinz
15.4.2025
Read more
  • Coding
  • Machine Learning
  • R
Tuning Random Forest on Time Series Data
Team statworx
15.4.2025
Read more
  • Data Science
  • Statistics & Methods
Model Regularization – The Bayesian Way
Thomas Alcock
15.4.2025
Read more
  • Coding
  • Python
  • Statistics & Methods
How to Speed Up Gradient Boosting by a Factor of Two
Team statworx
15.4.2025
Read more
  • Coding
  • Frontend
  • R
Dynamic UI Elements in Shiny – Part 2
Team statworx
15.4.2025
Read more
  • Coding
  • R
Why Is It Called That Way?! – Origin and Meaning of R Package Names
Team statworx
15.4.2025
Read more
  • Data Engineering
  • Python
Access your Spark Cluster from Everywhere with Apache Livy
Team statworx
15.4.2025
Read more
  • Coding
  • Data Engineering
  • Data Science
Testing REST APIs With Newman
Team statworx
14.4.2025
Read more
  • Machine Learning
  • Python
  • R
XGBoost Tree vs. Linear
Fabian Müller
14.4.2025
Read more
  • Data Science
  • R
Combining Price Elasticities and Sales Forecastings for Sales Improvement
Team statworx
14.4.2025
Read more
  • Data Science
  • Machine Learning
  • R
Time Series Forecasting With Random Forest
Team statworx
14.4.2025
Read more
  • Data Visualization
  • R
Community Detection with Louvain and Infomap
Team statworx
14.4.2025
Read more
  • Machine Learning
Machine Learning Goes Causal II: Meet the Random Forest’s Causal Brother
Team statworx
11.4.2025
Read more
  • Coding
  • Data Visualization
  • R
Animated Plots using ggplot and gganimate
Team statworx
8.4.2025
Read more
  • Artificial Intelligence
AI Trends Report 2025: All 16 Trends at a Glance
Tarik Ashry
25.2.2025
Read more
  • Artificial Intelligence
  • Data Science
  • GenAI
How a CustomGPT Enhances Efficiency and Creativity at hagebau
Tarik Ashry
15.1.2025
Read more
  • Artificial Intelligence
  • Data Science
  • Human-centered AI
Explainable AI in practice: Finding the right method to open the Black Box
Jonas Wacker
15.1.2025
Read more
  • Artificial Intelligence
  • GenAI
  • statworx
Back to the Future: The Story of Generative AI (Episode 4)
Tarik Ashry
6.12.2024
Read more
  • Artificial Intelligence
  • GenAI
  • statworx
Back to the Future: The Story of Generative AI (Episode 3)
Tarik Ashry
6.12.2024
Read more
  • Artificial Intelligence
  • GenAI
  • statworx
Back to the Future: The Story of Generative AI (Episode 2)
Tarik Ashry
6.12.2024
Read more
  • Artificial Intelligence
  • Data Culture
  • Data Science
  • Deep Learning
  • GenAI
  • Machine Learning
AI Trends Report 2024: statworx COO Fabian Müller Takes Stock
Tarik Ashry
6.12.2024
Read more
  • Artificial Intelligence
  • GenAI
  • statworx
Custom AI Chatbots: Combining Strong Performance and Rapid Integration
Tarik Ashry
6.12.2024
Read more
  • Artificial Intelligence
  • GenAI
  • statworx
Back to the Future: The Story of Generative AI (Episode 1)
Tarik Ashry
6.12.2024
Read more
  • Artificial Intelligence
  • Data Culture
  • Human-centered AI
AI in the Workplace: How We Turn Skepticism into Confidence
Tarik Ashry
6.12.2024
Read more
  • Artificial Intelligence
  • GenAI
  • statworx
Generative AI as a Thinking Machine? A Media Theory Perspective
Tarik Ashry
6.12.2024
Read more
  • Artificial Intelligence
  • Data Culture
  • Human-centered AI
How managers can strengthen the data culture in the company
Tarik Ashry
6.12.2024
Read more
  • Artificial Intelligence
  • Data Science
How we developed a chatbot with real knowledge for Microsoft
Isabel Hermes
6.12.2024
Read more
  • Data Science
  • Data Visualization
  • Frontend Solution
Why Frontend Development is Useful in Data Science Applications
Jakob Gepp
6.12.2024
Read more
  • Artificial Intelligence
  • Human-centered AI
  • statworx
the byte - How We Built an AI-Powered Pop-Up Restaurant
Sebastian Heinz
6.12.2024
Read more
  • Artificial Intelligence
  • Data Science
  • GenAI
The Future of Customer Service: Generative AI as a Success Factor
Tarik Ashry
6.12.2024
Read more
  • Artificial Intelligence
  • Human-centered AI
  • Strategy
The AI Act is here – These are the risk classes you should know
Fabian Müller
6.12.2024
Read more
  • Artificial Intelligence
  • Human-centered AI
  • Machine Learning
Gender Representation in AI – Part 2: Automating the Generation of Gender-Neutral Versions of Face Images
Team statworx
6.12.2024
Read more
  • Data Science
  • Human-centered AI
  • Statistics & Methods
Unlocking the Black Box – 3 Explainable AI Methods to Prepare for the AI Act
Team statworx
6.12.2024
Read more
  • Artificial Intelligence
  • Human-centered AI
  • Strategy
How the AI Act will change the AI industry: Everything you need to know about it now
Team statworx
6.12.2024
Read more
  • Artificial Intelligence
  • Recap
  • statworx
Big Data & AI World 2023 Recap
Team statworx
6.12.2024
Read more
  • Artificial Intelligence
  • Data Science
  • Statistics & Methods
A first look into our Forecasting Recommender Tool
Team statworx
6.12.2024
Read more
  • Artificial Intelligence
  • Data Science
On Can, Do, and Want – Why Data Culture and Death Metal have a lot in common
David Schlepps
6.12.2024
Read more
  • Artificial Intelligence
  • Deep Learning
  • Machine Learning
How to create AI-generated avatars using Stable Diffusion and Textual Inversion
Team statworx
6.12.2024
Read more
  • Artificial Intelligence
  • Data Science
  • Strategy
Decoding the secret of Data Culture: These factors truly influence the culture and success of businesses
Team statworx
6.12.2024
Read more
  • Artificial Intelligence
  • Human-centered AI
  • Machine Learning
GPT-4 - A categorisation of the most important innovations
Mareike Flögel
6.12.2024
Read more
  • Artificial Intelligence
  • Human-centered AI
  • Strategy
Knowledge Management with NLP: How to easily process emails with AI
Team statworx
6.12.2024
Read more
  • Artificial Intelligence
  • Deep Learning
  • Machine Learning
3 specific use cases of how ChatGPT will revolutionize communication in companies
Ingo Marquart
6.12.2024
Read more
  • Artificial Intelligence
  • Machine Learning
  • Tutorial
Paradigm Shift in NLP: 5 Approaches to Write Better Prompts
Team statworx
6.12.2024
Read more
  • Recap
  • statworx
Ho ho ho – Christmas Kitchen Party
Julius Heinz
6.12.2024
Read more
  • Artificial Intelligence
  • Deep Learning
  • Machine Learning
Real-Time Computer Vision: Face Recognition with a Robot
Sarah Sester
6.12.2024
Read more
  • Recap
  • statworx
statworx @ UXDX Conf 2022
Markus Berroth
6.12.2024
Read more
  • Data Engineering
  • Tutorial
Data Engineering – From Zero to Hero
Thomas Alcock
6.12.2024
Read more
  • Recap
  • statworx
statworx @ vuejs.de Conf 2022
Jakob Gepp
6.12.2024
Read more
  • Data Engineering
  • Data Science
Application and Infrastructure Monitoring and Logging: metrics and (event) logs
Team statworx
6.12.2024
Read more
  • Data Engineering
  • Data Science
  • Python
How to Scan Your Code and Dependencies in Python
Thomas Alcock
6.12.2024
Read more
  • Cloud Technology
  • Data Engineering
  • Data Science
How to Get Your Data Science Project Ready for the Cloud
Alexander Broska
6.12.2024
Read more
  • Artificial Intelligence
  • Human-centered AI
  • Machine Learning
Gender Repre­sentation in AI – Part 1: Utilizing StyleGAN to Explore Gender Directions in Face Image Editing
Isabel Hermes
6.12.2024
Read more
  • R
The helfRlein package – A collection of useful functions
Jakob Gepp
6.12.2024
Read more
  • Data Engineering
  • Data Science
  • Machine Learning
Data-Centric AI: From Model-First to Data-First AI Processes
Team statworx
6.12.2024
Read more
  • Artificial Intelligence
  • Deep Learning
  • Human-centered AI
  • Machine Learning
DALL-E 2: Why Discrimination in AI Development Cannot Be Ignored
Team statworx
6.12.2024
Read more
  • Artificial Intelligence
  • Human-centered AI
statworx AI Principles: Why We Started Developing Our Own AI Guidelines
Team statworx
6.12.2024
Read more
  • Recap
  • statworx
5 highlights from the Zurich Digital Festival 2021
Team statworx
6.12.2024
Read more
  • Recap
  • statworx
Unfold 2022 in Bern – by Cleverclip
Team statworx
6.12.2024
Read more
  • Data Science
  • Human-centered AI
  • Machine Learning
  • Strategy
Why Data Science and AI Initiatives Fail – A Reflection on Non-Technical Factors
Team statworx
6.12.2024
Read more
  • Machine Learning
  • Python
  • Tutorial
How to Build a Machine Learning API with Python and Flask
Team statworx
6.12.2024
Read more
  • Artificial Intelligence
  • Data Science
  • Human-centered AI
  • Machine Learning
Break the Bias in AI
Team statworx
6.12.2024
Read more
  • Artificial Intelligence
  • Cloud Technology
  • Data Science
  • Sustainable AI
How to Reduce the AI Carbon Footprint as a Data Scientist
Team statworx
6.12.2024
Read more
  • Coding
  • Data Engineering
Automated Creation of Docker Containers
Stephan Emmer
6.12.2024
Read more
  • Coding
  • Data Visualization
  • R
Customizing Time and Date Scales in ggplot2
Team statworx
6.12.2024
Read more
  • Artificial Intelligence
  • Data Science
  • Machine Learning
5 Types of Machine Learning Algorithms With Use Cases
Team statworx
6.12.2024
Read more
  • Coding
  • Machine Learning
  • Python
Data Science in Python - Getting started with Machine Learning with Scikit-Learn
Team statworx
6.12.2024
Read more
  • Recap
  • statworx
2022 and the rise of statworx next
Sebastian Heinz
6.12.2024
Read more
  • Recap
  • statworx
As a Data Science Intern at statworx
Team statworx
6.12.2024
Read more
  • Artificial Intelligence
  • Data Science
  • Human-centered AI
  • Machine Learning
  • statworx
Column: Human and machine side by side
Sebastian Heinz
6.12.2024
Read more
  • Data Engineering
  • Data Science
  • Machine Learning
Deploy and Scale Machine Learning Models with Kubernetes
Team statworx
6.12.2024
Read more
  • Coding
  • Python
  • Tutorial
statworx Cheatsheets – Python Basics Cheatsheet for Data Science
Team statworx
6.12.2024
Read more
  • Cloud Technology
  • Data Engineering
  • Machine Learning
3 Scenarios for Deploying Machine Learning Workflows Using MLflow
Team statworx
6.12.2024
Read more
  • Data Science
  • statworx
  • Strategy
STATWORX meets DHBW – Data Science Real-World Use Cases
Team statworx
6.12.2024
Read more
  • Coding
  • Deep Learning
Car Model Classification I: Transfer Learning with ResNet
Team statworx
6.12.2024
Read more
  • Artificial Intelligence
  • Deep Learning
  • Machine Learning
Car Model Classification IV: Integrating Deep Learning Models With Dash
Dominique Lade
6.12.2024
Read more
  • Artificial Intelligence
  • Deep Learning
  • Machine Learning
Car Model Classification III: Explainability of Deep Learning Models With Grad-CAM
Team statworx
6.12.2024
Read more
  • Artificial Intelligence
  • Coding
  • Deep Learning
Car Model Classification II: Deploying TensorFlow Models in Docker Using TensorFlow Serving
No items found.
6.12.2024
Read more
  • AI Act
Potential Not Yet Fully Tapped – A Commentary on the EU’s Proposed AI Regulation
Team statworx
6.12.2024
Read more
  • Artificial Intelligence
  • Deep Learning
  • statworx
Creaition – revolutionizing the design process with machine learning
Team statworx
6.12.2024
Read more
  • Data Science
  • Deep Learning
The 5 Most Important Use Cases for Computer Vision
Team statworx
6.12.2024
Read more
  • Artificial Intelligence
  • Data Science
  • Machine Learning

Generative Adversarial Networks: How Data Can Be Generated With Neural Networks
Team statworx
6.12.2024
Read more
  • Data Engineering
5 Technologies That Every Data Engineer Should Know
Team statworx
6.12.2024
Read more
This is some text inside of a div block.