Community Detection with Louvain and Infomap


In my last blog post, I wrote about networks and their visualization in R. For the coloring of the objects, I clustered the Les Miserables characters in several groups with Louvain, a Community detection algorithm.
Community detection algorithms are not only useful for grouping characters in French lyrics. At statworx, we use these methods to give our clients insights into their product portfolio, customer, or market structure. In this blog post, I want to show you the magic behind Community detection and give you a theoretical introduction into the Louvain and Infomap algorithm.
Find groups with a high density of connections within and a low density between groups
Networks are useful constructs to schematize the organization of interactions in social and biological systems. They are just as well suited to represent interactions in the economy, especially in marketing. Such an interaction can be a joint purchase of two or more products or a joint comparison of products in online shops or on price comparison portals.
Networks consist of objects and connections between the objects. The connections, also called edges, can be weighted according to certain criteria. In marketing, for example, the number or frequency of joint purchases of two products is a significant weighting of the connection between these two products. Mostly, such real networks are so big and complex that we have to simplify their structure to get useful information from them. The methods of community detection help to find groups in the network with a high density of connections within and a low density of links between groups.
We will have a look at the two methods Louvain Community Detection and Infomap because they gave the best results in the study of Lancchinetti and Fortunato (2009) when applied to different benchmarks on Community Detection methods.
Louvain: Build clusters with high modularity in large networks
The Louvain Community Detection method, developed by Blondel et al. (2008), is a simple algorithm that can quickly find clusters with high modularity in large networks.
Modularity
The so-called modularity measures the density of connections within clusters compared to the density of connections between clusters (Blondel 2008). It is used as an objective function to be maximized for some community detection techniques and takes on values between -1 and 1. In the case of weighted connections between the objects, we can define the modularity with the following formula:
$$ Q=frac{1}{2m}sumnolimits_{p,q} [A_{pq}-frac{k_{p}k_{q}}{2m}]delta(C_{p}, C_{q}) $$
with:
$A_{pq}$: Weight of a connection between object $p$ and $q$
$k_{p}$: $sumnolimits_{q}A_{pq}$ = Sum of the weights of all connections originating from the object $p$
$C_{p}$: Cluster to which the object $p$ has been assigned
$delta(C_{p}, C_{q})$: Dummy variable that takes the value 1 if both objects $p$ and $q$ are assigned to the same cluster
$m$: $frac{1}{2}sumnolimits_{p,q} A_{pq}$ = Sum of the weights of all connections between all existing objects, divided by 2
Phases
The algorithm is divided into two phases, which are repeated until the modularity cannot be maximized further. In the 1st phase, each object is considered as a separate cluster. For each object $p$ $(p = 1, …, N)$, its neighbors $q$ $(q = 1, …, N)$ are checked for whether the modularity increases if $p$ is removed from its cluster and into the cluster of an object $q$ is assigned. The object $p$ is then assigned to the cluster, which maximizes the increase in modularity. However, this only applies in the case of a positive increase. If no positive increase in modularity can be realized by shifting, the object $p$ remains in its previous cluster. The process described above will be repeated and sequentially performed for all objects until no improvement in modularity can be achieved. An object is often viewed and assigned several times. The 1st phase thus stops when a local maximum has been found, i.e., if no individual displacement of an object can improve the modularity
Building on the clusters formed in the 1st phase, a new network is created in the 2nd phase whose objects are now the clusters themselves, which were formed in the 1st phase. To obtain weights for the connections between the clusters, the sum of the weights of the connections between the objects of two corresponding clusters is used. If such a new network was formed with "metacluster", the steps of the 1st phase will be applied to the new network next, and the modularity will be further optimized. A complete run of both phases is called a pass. Such passes are repeatedly carried out until there is no more change in the cluster, and a maximum of modularity is achieved.
Infomap: Minimize the description length of a random walk
The Infomap method was first introduced by Rosvall and Bergstrom (2008). The procedure of the algorithm is in the core identical to the procedure of Blondel. The algorithm repeats the two described phases until an objective function is optimized. However, as an objective function to be optimized, Infomap does not use modularity but the so-called map equation.
Map Equation
The map equation exploits the duality between finding cluster structures in networks and minimizing the description length of the motion of a so-called random walk (Bohlin 2014). This random walker randomly moves from object to object in the network. The more the connection of an object is weighted, the more likely the random walker will use that connection to reach the next object. The goal is to form clusters in which the random walker stays as long as possible, i.e., the weights of the connections within the cluster should take on greater values than the weights of the connections between objects of different clusters. The map equation code structure is designed to compress the descriptive length of the random walk when the random walker lasts for extended periods of time in certain regions of the network. Therefore, the goal is to minimize the map equation, which is defined as follows for weighted but undirected networks (Rosvall 2009):
$$ L(M)=wcurvearrowright log(wcurvearrowright)-2sum_{k=1}^K w_{k}curvearrowright log(w_{i}curvearrowright)-sum_{i=1}^N w_{i}log(w_{i})+sum_{k=1}^K (w_{k}curvearrowright+w_{i})log(w_{k}curvearrowright+w_{k}) $$
with:
$M$: Network with $N$ objects ($i = 1, …, N$) and $K$ clusters ($k = 1, …, K$)
$w_{i}$: relative weight of all connections of an object i, that is the sum of the weights of all connections of an object divided by the sum of the weights of all connections of the network
$w_{k}$: $sumnolimits_{iin k}w_{i}$: Sum of the relative weights of all connections of the objects of the cluster $k$
$w_{k}curvearrowright$: Sum of the relative weights of all connections of the objects of the cluster $k$ leaving the cluster (connections to objects from other clusters)
$wcurvearrowright$: $sum_{k=1}^K w_{k}$ = Sum of the weights of all connections between objects from different clusters
This definition of the map equation is based on the so-called entropy, the average information content, or the information density of a message. This term is based on Shannon’s Source Coding Theorem, from the field of Information Theory (Rosvall 2009).
The procedure described above is hereafter referred to as the main algorithm. Objects that were assigned to the same cluster in the first phase of the main algorithm when the new network was created can only be moved together in the second phase. A previously optimal shift into a specific cluster no longer necessarily has to be optimal in a later pass (Rosvall 2009).
Extensions
Thus, theoretically, there may be even better cluster divisions than the main algorithm solution. In order to improve the solution of the main algorithm, there are two extensions compared to Louvain Community Detection:
Subcluster shift: The subcluster shift sees each cluster as its own network and applies the main algorithm to that network. Thus, one or more subclusters in each cluster, in the previous step, create optimal partitioning of the network. All subclusters are reassigned to their cluster and can now be moved freely between the clusters. By applying the main algorithm, it can be tested whether the shift of one subcluster into another cluster leads to a minimization of the map equation compared to the previously optimal cluster distribution (Rosvall 2009).
Single object displacement: Each object is again considered as a separate cluster so that the displacement of individual objects between the optimal clusters determined in the previous step is possible. By applying the main algorithm, it can be determined whether the displacement of individual objects between the clusters can lead to further optimization of the map equation (Rosvall 2009). The two extensions are repeated sequentially until the map equation cannot be further minimized and an optimum has been achieved.
How does the Louvain algorithm work in an easy example?
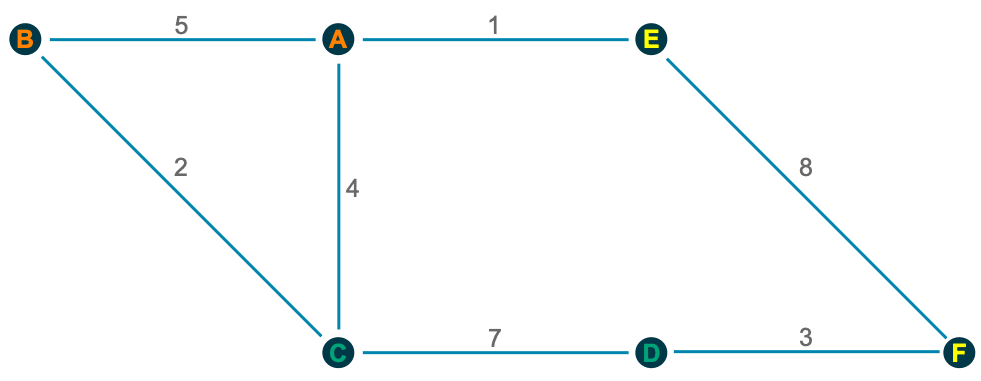
As we can see, the core of both methods is to build clusters and reallocate objects in two phases to optimize an objective function. To get a better understanding of how these two phases work, let me illustrate the Louvain Community Detection method with an easy example, a network with six nodes:

1st Phase
In the beginning, each object is separated into its own cluster, and we have to check if the modularity gets maximized if we assign it to another cluster. Only a positive change in modularity leads to a cluster shift.
For object A, for example, the calculations behind it look like the following:
A → B: $ Q_{AB}=5-frac{10*7}{30}=2.667 $
A → C: $ Q_{AC}=4-frac{10*13}{30}=-0.333 $
A → E: $ Q_{AE}=1-frac{10*9}{30}=-2 $
Similarly, we can check for all other objects if a shift to another cluster maximizes the modularity:
B → C: $Q_{BC}=2-frac{7*13}{30}=-1.033$
C → D: $Q_{CD}=7-frac{13*10}{30}=2.667$
D → F: $Q_{CD}=3-frac{10*11}{30}=-0.667$
E → F: $Q_{AB}=8-frac{9*11}{30}=4.7$
2nd Phase
Now we try to combine the clusters built in the 1st phase:
Orange → Green: $ Q_{Or,Gr}=6-frac{7*9}{10}=-0.3 $
Orange → Yellow: $ Q_{Or, Ye}=1-frac{7*4}{10}=-1.8 $
Green → Yellow: $ Q_{Gr, Ye}=3-frac{9*4}{10}=-0.6 $
We can see that none of the assignments of a cluster to another cluster can improve the modularity. Hence we can finish Pass 1.

Because we have no change in the second phase of pass 1, no further passes are required because a maximum of modularity is already achieved. In larger networks, of course, more passes are required, since there the clusters can consist of significantly more objects.
In R only the package igraph is needed to apply both methods
All we need to use these two Community detection algorithms is the package igraph, which is a collection of network analysis tools and in addition a list or a matrix with the connections between the objects in our network.
In our example we use the Les Misérables Characters network to cluster the characters in several groups. Therefore, we load the dataset lesmis, which you can find in the package geomnet.
We need to extract the edges out of lesmis and convert it into a data.frame. Afterward, you have to convert this into an igraph graph. To use the weights of every connection, we need to rename the weight column so that the algorithm can identify the weights. The resulting graph can be used as the input for the two algorithms.
# Libraries --------------------------------------------------------------

library(igraph)
library(geomnet)


# Data Preparation -------------------------------------------------------

#Load dataset
data(lesmis)

#Edges
edges <- as.data.frame(lesmis[1])
colnames(edges) <- c("from", "to", "weight")

#Create graph for the algorithms
g <- graph_from_data_frame(edges, directed = FALSE)
Now we are ready to find the communities with the functions cluster_louvain() respectively cluster_infomap()
Furthermore, we can have a look to which community the characters are associated (membership()) or get a list with all communities and their members (communities()).
# Community Detection ----------------------------------------------------

# Louvain
lc <- cluster_louvain(g)
membership(lc)
communities(lc)
plot(lc, g)

# Infomap
imc <- cluster_infomap(g)
membership(imc)
communities(imc)
plot(lc, g)
If you want to visualize these results afterward, have a look at my last blog post or use the above-shown plot() function for fast visualization. As you can see in the following, the fast plotting option is not as beautiful as with the package visNetwork. In addition, it is also not interactive.


Conclusion
Both algorithms outperform other community detection algorithms (Lancchinetti, 2009). They have excellent performance, and Infomap delivers slightly better results in this study than Louvain. Moreover, we should consider two additional facts when choosing between these two algorithms.
First, both algorithms do their job very fast. If we apply them on large networks, we can see that Louvain outperforms dramatically.
Second, Louvain cannot separate outliers. This could explain why the algorithms divide people into almost identical clusters, but Infomap cuts out a few people from some clusters, and they form their own cluster. We should keep these points in mind when we have to decide between both algorithms. Another approach could be to use them both and compare their solutions.
Did I spark your interest to cluster your own networks? Feel free to use my code or contact me if you have any questions.
References
- Blondel, Vincent D. / Guillaume, Jean L. / Lambiotte, Renaud / Lefebvre, Etienne (2008), “Fast unfolding of communities in large networks”, Journal of Statistical Mechanics: Theory and Experiment, Jg.2008, Nr.10, P10008
- Bohlin, Ludvig / Edler, Daniel / Lancichinetti, Andrea / Rosvall, Martin (2014), “Community Detection and Visualization of Networks with the Map Equation Framework”, in: Measuring Scholary Impact: Methods and Practice (Ding, Ying / Rousseau, Ronald / Wolfram, Dietmar, Eds.), S.3-34, Springer-Verlag, Berlin
- Lancichinetti, Andrea / Fortunato, Santo (2009), ” Community detection algorithms: a comparative analysis”, Physical review E, Jg.80, Nr.5, 056117
- Rosvall, Martin / Bergstrom, Carl T. (2008), “Maps of random walks on complexe net- works reveal community structure”, Proceedings of the National Academy of Sciences USA, Jg.105, Nr.4, S.1118-1123
- Rosvall, Martin / Axellson, Daniel / Bergstrom, Carl T. (2009), “The map equation”, The European Physical Journal Special Topics, Jg.178, Nr.1, S.13-23


