Error handling in R – Debugging with RStudio

The blog series "Error Handling in R" is about efficiently and systematically checking R code. It begins with finding errors through debugging, continues with handling errors, and concludes with unit testing, which is used to verify the correct functionality of R code. The series starts with debugging in R, a broad topic. Therefore, this article focuses on the debugging options provided by RStudio.
Debugging helps to determine where in the code an error occurs or where the code behaves differently than expected. In general, this involves three steps:
- Running the code
- Stopping the code at the point where the error is suspected
- Stepping through the code line by line and inspecting it
Entering Debugging Mode
To enter debugging mode, RStudio must be instructed when to stop computations. There is no "pause button" that allows stopping a running computation to enter debugging mode. This is the case in almost all other programming languages since computations usually execute too quickly to stop at the correct point. Instead, the stopping point must be determined in advance. This should not be confused with the "Stop" button above the console, which completely aborts the computation.
Stopping Before a Line
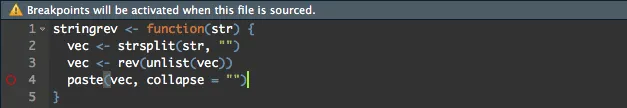
The simplest and most commonly used way to enter debugging mode is by setting a breakpoint in the code editor. This can be easily done in RStudio by clicking to the left of the line number or by pressing Shift+F9 on the keyboard while simultaneously clicking with the mouse on the desired line.
A tracing function is inserted within the actual function. The breakpoint is indicated by a solid red circle in the editor. Additionally, a quick overview of which function contains a breakpoint can be obtained by looking at the Environment window, where the function is also marked with a red circle.
If the function does not yet exist, either because the file has not been sourced or because the function in the environment and the editor differ, the breakpoint cannot yet be activated. This is indicated by an unfilled circle.
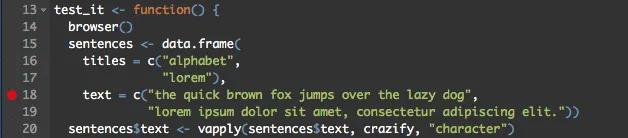
In most cases, sourcing the file once helps, as it inserts the tracking function and makes the breakpoint ready to use. When setting the breakpoint via the RStudio editor, it is not necessary to modify the function manually and add additional code. However, there are certain situations where these breakpoints do not work, such as with more complex function syntax. Additionally, conditional debugging is not yet supported by RStudio. In such cases, the browser() function provides a solution. Since this is an actual function, it must be written into the code but can be added almost anywhere. Once active and called, editor breakpoints and browser() behave very similarly.
Stopping Before a Function Executes
The editor breakpoint or browser() is ideal for functions for which the source code is available. However, if the .R file is not accessible, an entire function can alternatively be debugged using debug() or debugonce(). To do this, the respective function is placed inside debug() or debugonce(), for example, debugonce(mean). This does not modify the function itself but starts the debugger immediately after the function call, essentially acting like placing a breakpoint at the beginning of the function.
debugonce() activates debug mode only once for the next time the function is called. In contrast, debug() activates the debugger every time the function is called, which, in the worst case, can result in an endless loop. Therefore, it is generally recommended to use debugonce(). The counterpart to debug() is undebug(), which is used when debugging should no longer be triggered every time the function is called.
Stopping on Errors
The third way to enter debugging mode is by setting the debugger to activate automatically whenever an error occurs. This causes the function to stop automatically and debugging mode to start immediately. This functionality is enabled via the RStudio interface by changing Debug -> On Error from "Error Inspector" to "Break in Code."
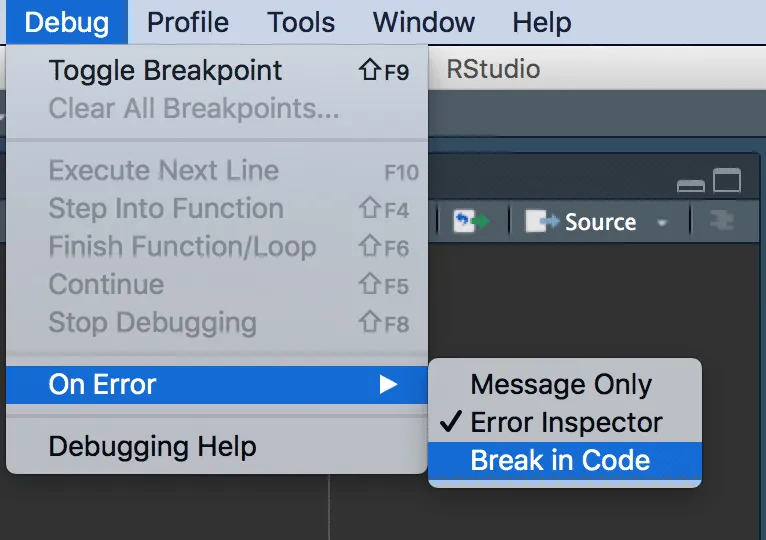
By default, however, the debugger is only activated when an error occurs in your own code. If you want to find an error that also involves third-party code, this setting can be changed under Tools -> Global Options by unchecking "Use debug error handler only when my code contains errors." Alternatively, the option can be permanently overridden with options(error = browser()). However, it can quickly become disruptive if the debugger is activated every time. Therefore, it is important to remember to reset this option with options(error = NULL) once debugging is complete. The next part of the "Error Handling in R" series focuses on effective debugging in R after the debugger has been activated.


