
On my daily commute to , I pass the gas station down the street twice a day. Even though I’m riding a bike, I’m still looking at the gas prices. Lately, after a few weeks of observation, I thought to have found some patterns. My statistic sensors were tickling!
Of course, I am not the first one to notice patterns. Nearly everyone has their own theory about when to buy cheap gas! Some of the more famous examples are:
- Everything was better in the old days
- It’s cheaper in the evening
- Gas stations at motorways are more expensive
- No-name stations have lower prices than top brands
- The difference between diesel and gas (E10) is shrinking
- It’s cheapest on Mondays
But, are these facts or just rumors? To check all those myths, I gathered some data, explored relations, and finally plotted my results!
FYI: The code I used will be presented in a future blog when I also will take a deeper look at my coding and optimization progress – stay tuned!
The king of gas price data
Since December 2013 all gas station in Germany must report their prices to the Markttransparenzstelle für Kraftstoffe, which is part of the Bundeskartellamt. While searching for this data, I stumbled upon the site . They had gathered the price data for nearly all gas stations since 2014. First, they only provided a data bank dump with all historical data, but since October 2018, they also offer a with daily csv files.
The data contain all price changes of around 15.000 gas stations, looking as follows:
date station_uuid diesel e5 e10
1: 2019-01-01 00:01:06 2ae0e4dc 1.319 1.399 1.379
2: 2019-01-01 00:01:06 08a67e2e 1.339 1.409 1.389
3: 2019-01-01 00:01:06 939f06e5 1.299 1.379 1.359
4: 2019-01-01 00:01:06 d299da0e 1.279 1.389 1.369
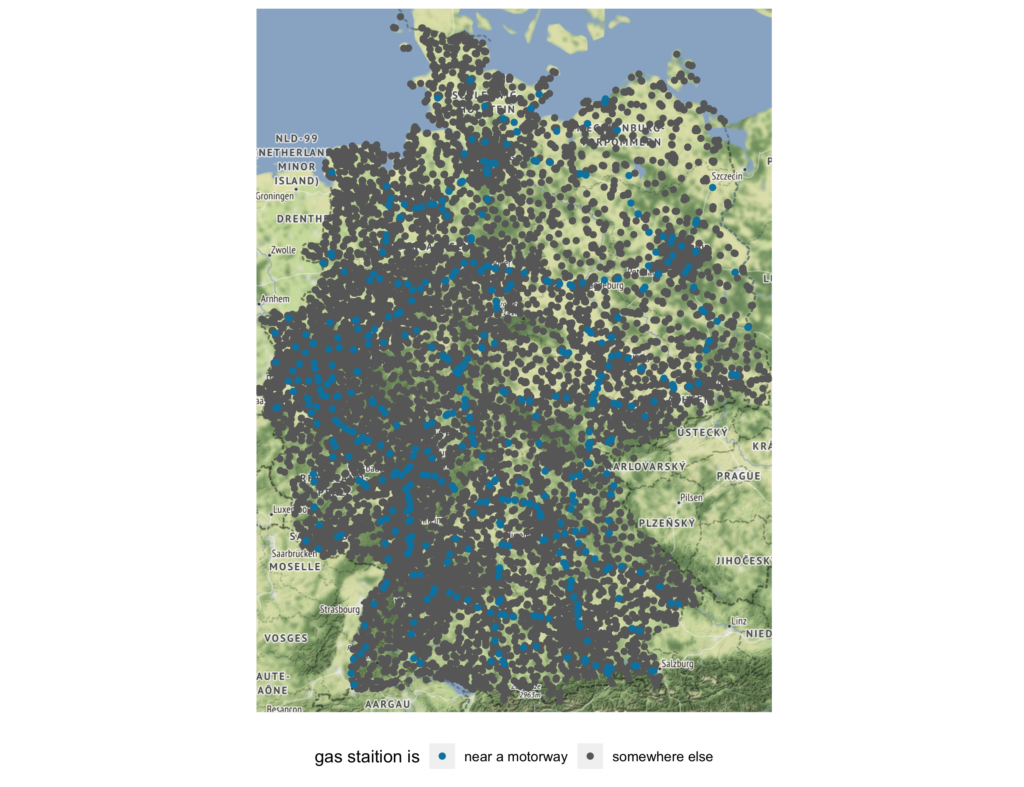
5: 2019-01-01 00:01:06 a1e15688 1.228 1.328 1.308In addition to the price information, tankerkoenig.de also provides additional information like the brand, the geo-coordinates and the city of each gas station. Since I was also interested in the fact whether a station is near a motorway or not, I included (the German automobile club). Of course, this did not seem to be complete, but good enough for my purpose. With the result, I was able to plot the stations, and the motorways emerged!
If you want to know more about how to make plots with geo-coordinates and ggplot2, check out !
Only believe the facts!
To confirm or debunk the myths I chose, I went ahead and filtered, aggregated, and merged the raw data. Be prepared for some nice plots and insights!
1. Everything was better in the old days
Nothing shows a development better than a good old timeline! As you can see in the following graphic, I plotted the mean price per day. To get a little more insight about the price ranges, I included the 10% and 90% quantiles of prices for each day.
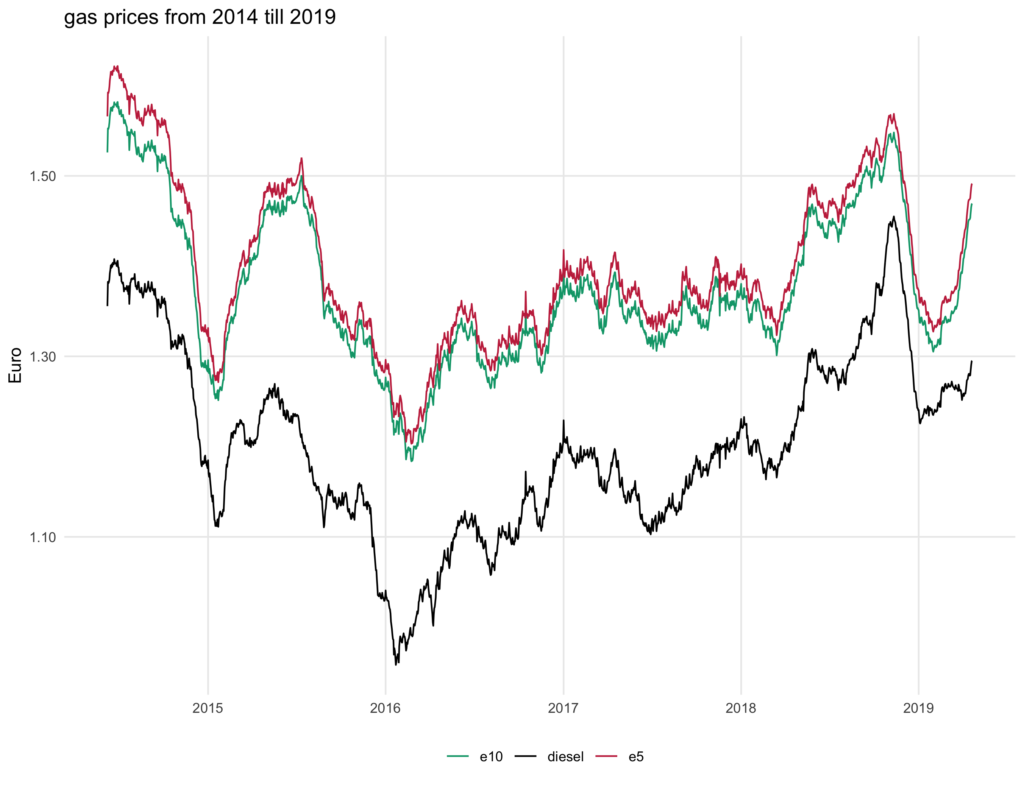
Of course, this was just a glimpse, and there were times (many years back) when the price was below 1DM (~0.5€). But for the last five years, the price was kind of within the same range. There was a low point early in 2016, but the latest peak was still a bit lower than in mid-2014.
Conclusion: For the “short-term” old days the myth does not hold up – for the “long-run” … probably yes!
2. It’s cheaper in the evening
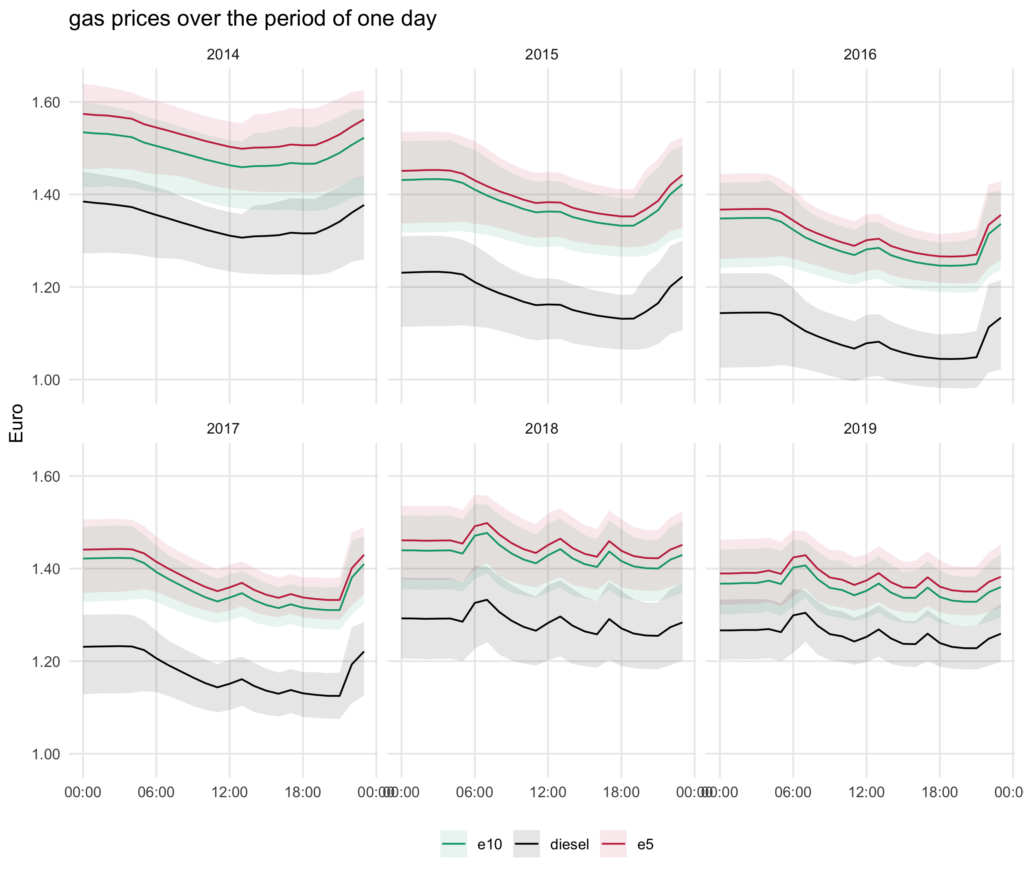
To check this myth, I aggregated the data over days and years. I noticed that there were different patterns over the years. From 2014 till 2017, there seemed to be a pattern where the price was high in the morning, slowly decreased over the day, with a small peak at noon, and rose up again in the evening. Since 2018, a new pattern with three peaks in a wave pattern emerged: The highest one in the morning around 7:00, one at noon and the last one around 17:00.
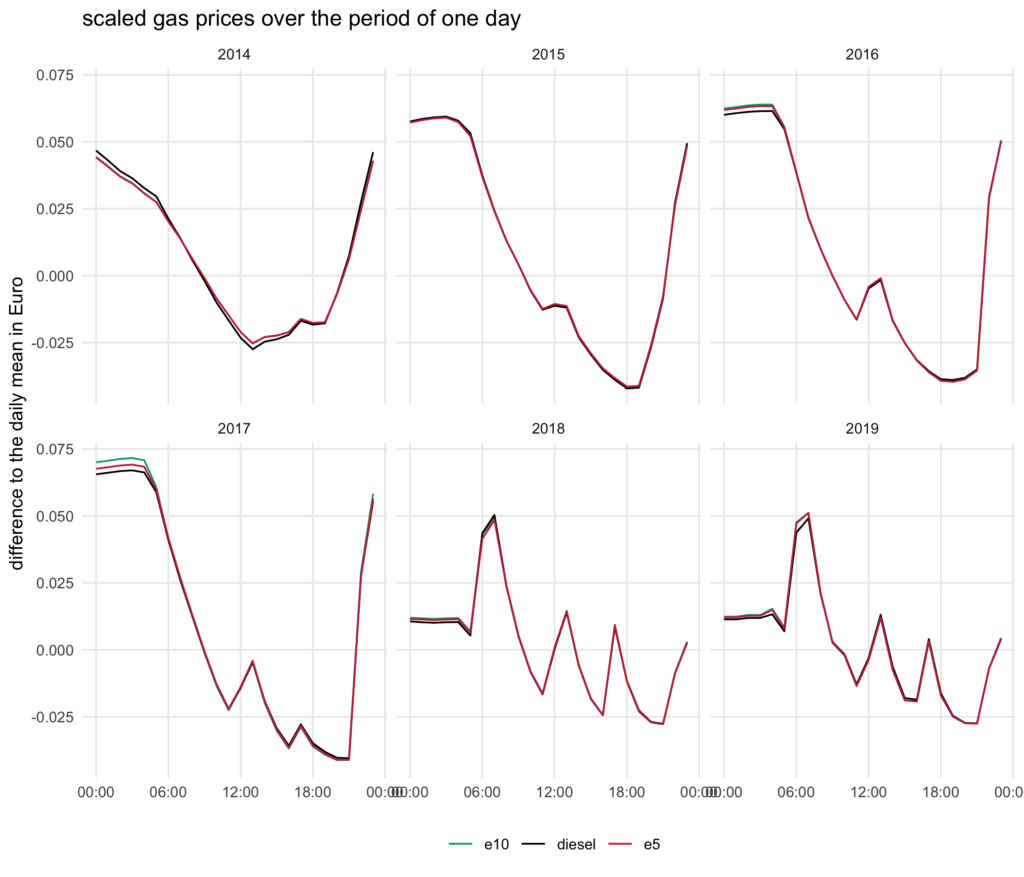
Since the price level varied a bit over the years, I also looked at the scaled prices. Here, the difference between the patterns was even more visible.
Conclusion: From 2015 to 2017, the myth seemed to be right. However, lately there were multiple “good times” across a day. Mostly right before the peak in the afternoon or the evening. As the price did not rise that much after its evening peak, the myth is still correct. The lowest point at the moment seemed to be around 21:00.
Update
While writing this post I found , that shows, that there is a new pattern with even more peaks!
3. Gas stations at motorways are more expensive
In the plot above I already showed where the motorway stations are – the blue dots. In the next plot, the blue lines represent the prices at those motorway stations. One can clearly spot the difference! Even though there are some stations within the 10% and 90% quartile range where the prices overlapped.
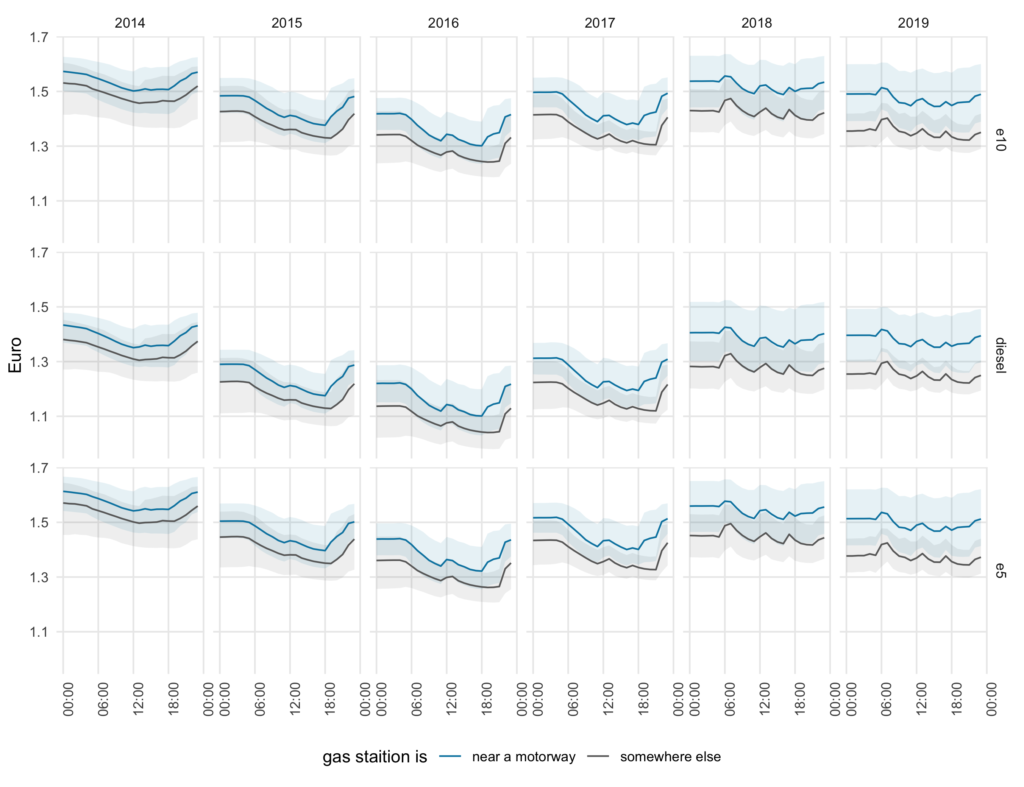
Conclusion: Obviously right!
4. No-name stations have lower prices than top brands
To get the top brands, I took the nine brands with the most stations in Germany and labelled the rest “other”. After that, I calculated the difference between mean price and mean price per brand. Therefore, lines above zero indicated that a brand is more expensive than the mean and vice versa.. Of the top brands, ARAL and SHELL were always above the mean, some fluctuated around the mean and some were always below the mean. The no-name stations were cheaper than the mean over the whole timespan.
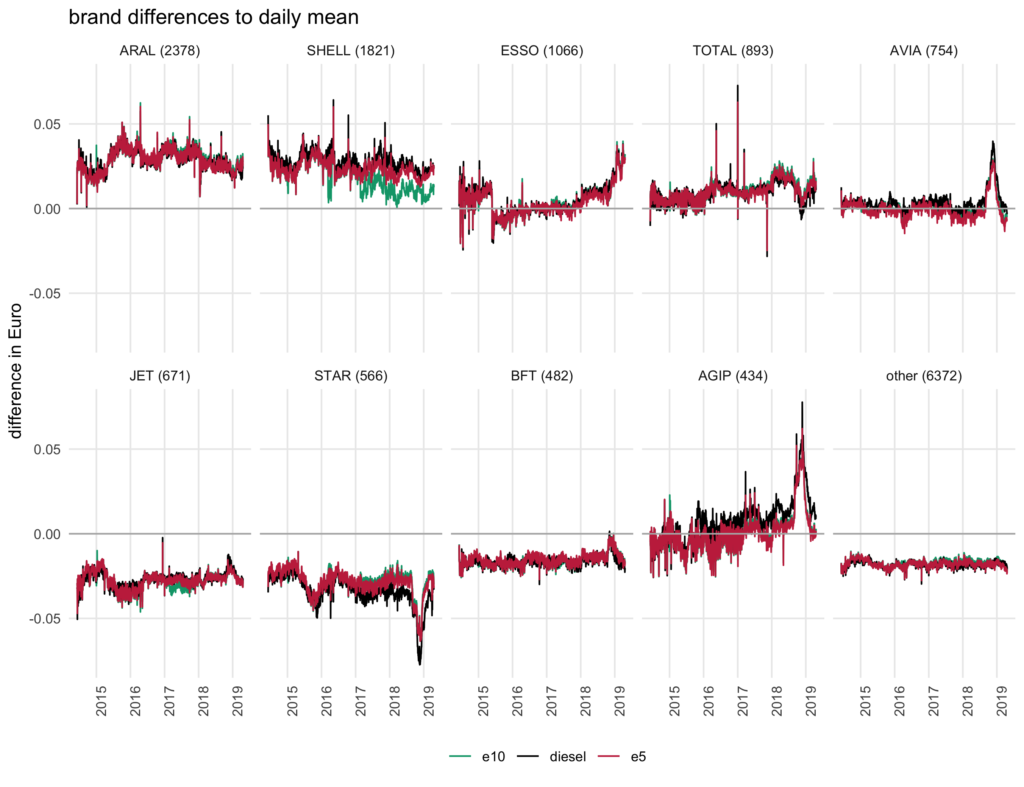
Conclusion: The result depends on how a no-name station is defined. Since the top five brands are mostly more expensive than the mean, I think the myth is somewhat right. At least, it is safe to say that there are differences between the brands.
5. The difference between diesel and gas (E10) is shrinking
To compare the differences, I took the E10 price as the baseline and plotted the other two types against it. Between E5 and E10 there was nearly no change over the last five years. However, for diesel, it was a story. Since 2014, the difference took a wild ride from 10% cheaper than E10 to 20% cheaper at the beginning of 2016 back to only 5% now.
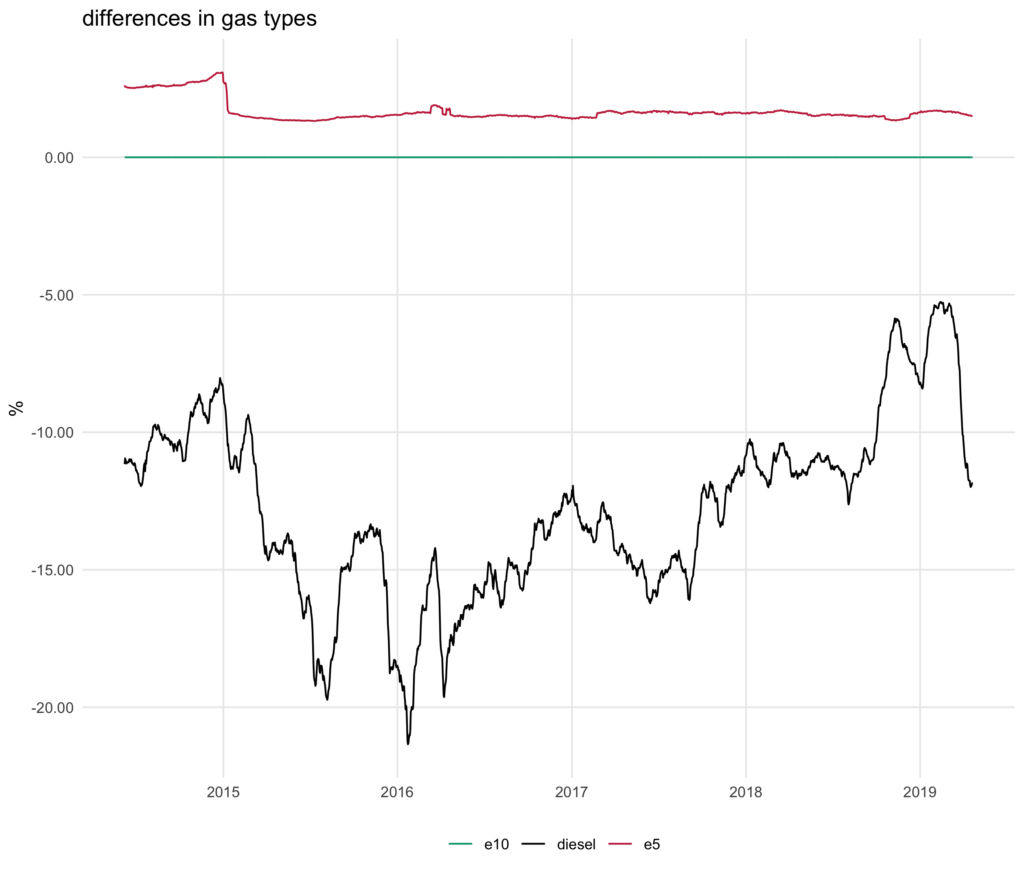
Conclusion: Yes, the difference is shrinking at the moment compared to the last five years.
6. It’s cheapest on Mondays
To check the last myth, I calculated the mean price per hour, type and weekday. The weekday with the lowest price at a given time can be seen in the following plot. All gas types revealed a similar pattern. Between the years, there was a subtle change mostly between Wednesday and Thursday.
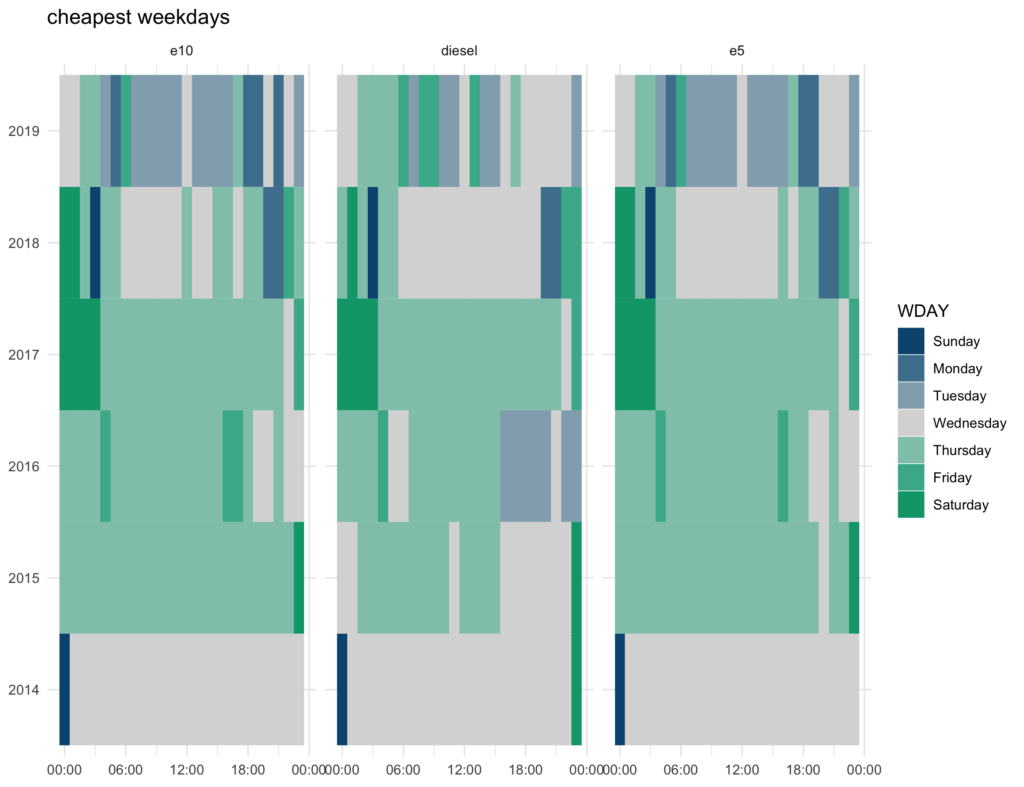
Conclusion: Since Monday barely ever was the cheapest day – this myth got debunked!
Conclusion
After all of that data hacking and pattern finding, these are my results:
- Everything was better in the old days – FALSEish
- It’s cheaper in the evening – TRUE
- Gas stations at motorways are more expensive – TRUE
- No-name stations have lower prices than top brands – TRUEish
- The difference between diesel and gas (e10) is shrinking – TRUE
- It’s cheapeast on Mondays – FALSE
Of course, this analysis is far from being complete and even had some shortcuts in it, as well. Still, I had a lot of fun analysing this big data set regardless of all the internal fights with my RAM. I will present some of these fights and their outcome in my next blog post. In that post, you will also get more information about my code optimisation process.
In another upcoming blog post, my colleague Matthias will use this data to predict the future price. So, stay tuned!
References
- The data is used under the Creative-Commons-Lizenz (CC BY 4.0). For more information on the data check out the