Once upon a time, we at STATWORX used Slack just as a messenger, but then everything changed when emojis came… Since then, we use them for all kinds of purposes. For example, we take polls with them to see where we will eat lunch or we capture unforgettable moments by creating new emojis. The possibilities are limitless! But since we use them so much, I was wondering how often do we use them. And when? And which is the top emoji?! Is it just the thumbsup?
To answer all these questions, I went on a little journey through my emotions.
Getting the data
The first part was to gather data. Well, since nearly every tool has a log history this was quite simple. I just had to get the history (the last year) of our Slack channels which were provided within JSONS. These I could easily load into R with the jsonlite package. To get a list of all possible emojis, I found this list from Cal Henderson who works at Slack. I added our own custom emojis to complete the list.
All that followed, was a little loop to go through each message and its reactions and count the occurrences of each emoji. Combined with the timestamp given in seconds from January the first in 1970, I had my emoji time-series data that looked like this:
                     EMOJI COUNT     TIME     TYPE       DATE
1: :slightly_smiling_face:     1 08:56:05  message 2018-08-10
2: :slightly_smiling_face:     1 17:08:19  message 2018-08-10
3:                  :gift:     2 08:36:04 reaction 2018-08-18
4:                   :joy:     1 13:47:10 reaction 2018-09-03
5:                    :+1:     1 13:56:12 reaction 2018-09-04
After evaluating each single text I found that more than every second chat (57%) either has an emoji in the messasge or as a reaction. So we really use them a lot!
The right timing
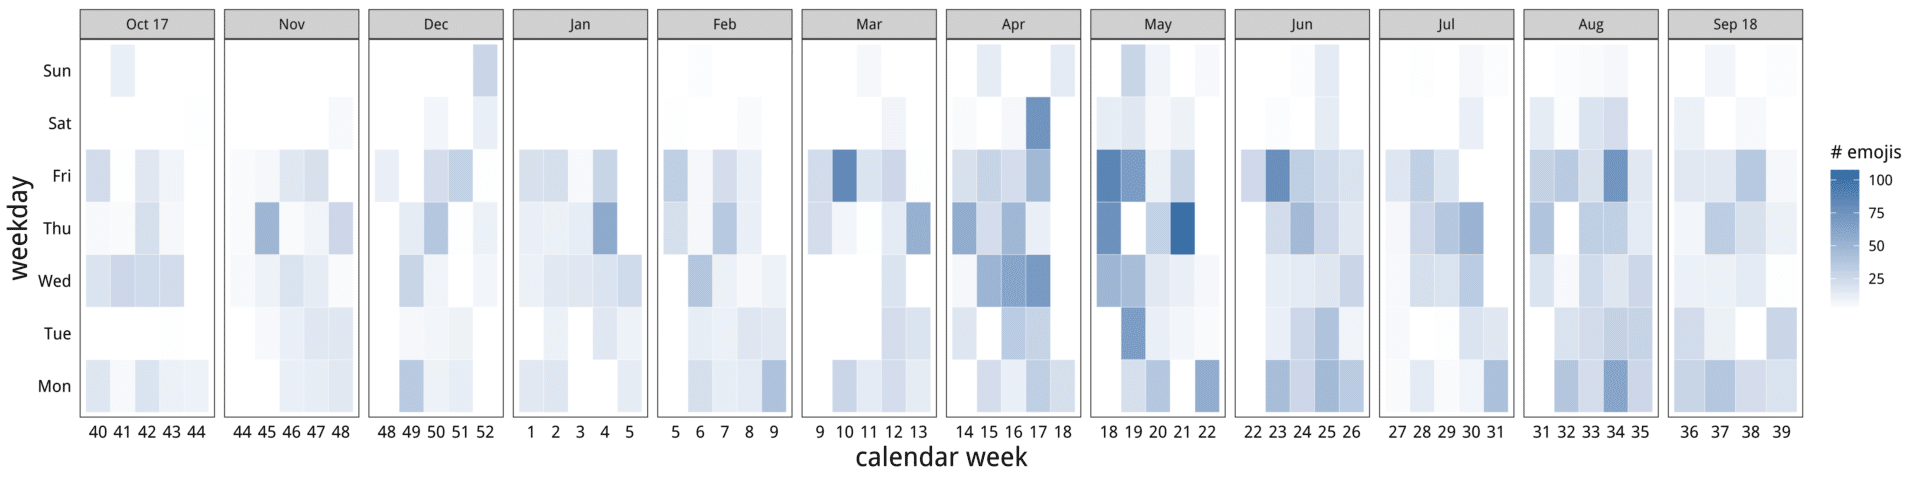
Since the majority was used as a reaction, I summed them up and did not distinguish between messages and reactions. To get a first idea of how often and when we use emojis I looked at a frequency plot over time. There are two things to notice: First, we see an increase over time. Well our company grew, so more people equals more emojis. Second, we tend to not use them during the weekend – who would have thought!?
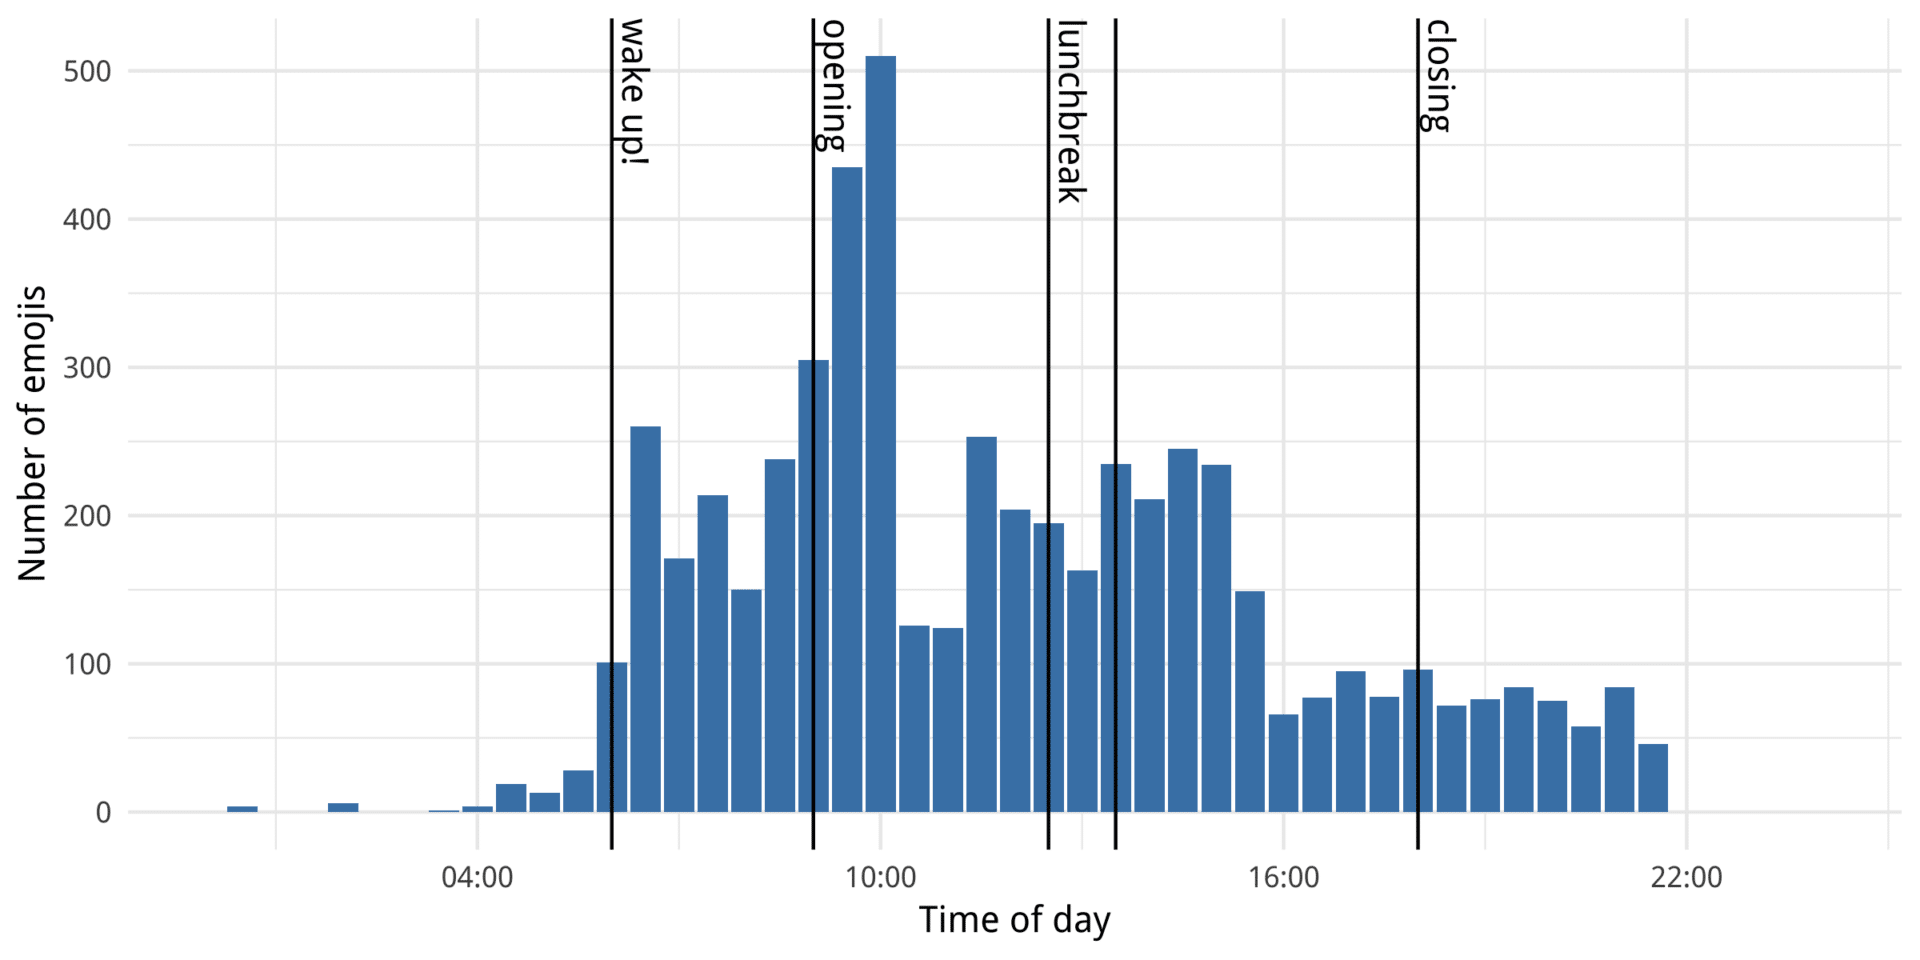
But what about our daily usage? Well there seem to be some peaks. One peak appears right after wake up time, another one when we arrive at the office. Here we can distinguish between colleagues with the mobil app and the ones that just use Slack with the desktop app. There is another peak around our lunchbreak and it comes all to end before we go to bed at 22:00.
Cause and effect
Since I started this little project, more and more questions popped into my head. For example: Is there a link between the emoji’s usage within a message and as a reaction? Are there words, that trigger us to use emojis? To answer the first questions, I used the networkD3 package to plot the interaction as a sankey diagram.
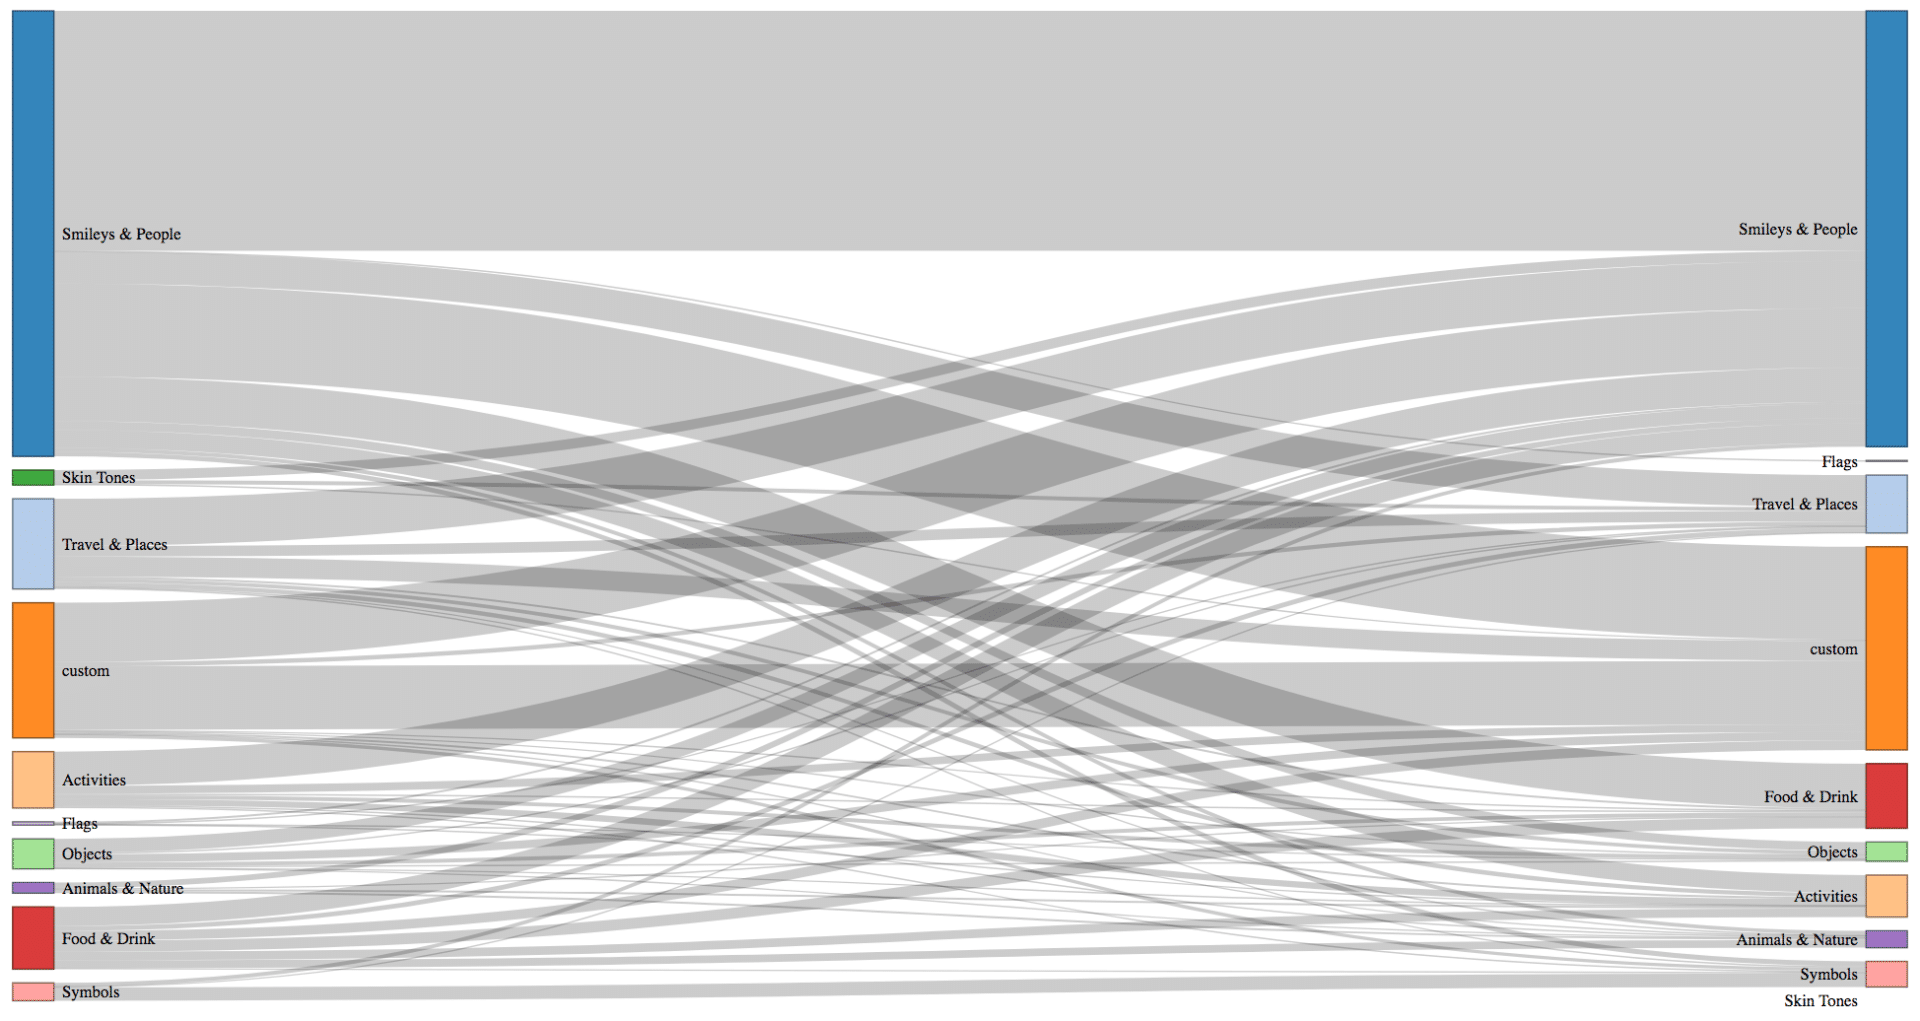
Here we can see which categories of emojis used within a message lead to which reactions. The most commonly used category is Smileys & People followed by custom. And around 40% stay within the same category.
To answer the second question I made some word clouds to see which words we use. The ones in orange are those where a reaction followed.
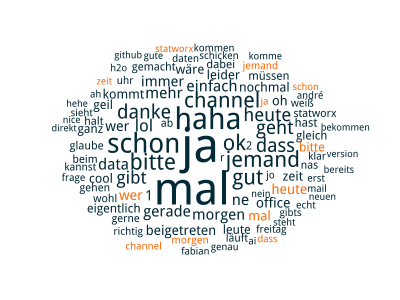
We can see, that we use more words with no emoji reaction than the other way around. If we only look at the ones with emoji reactions, then we get the following picture.
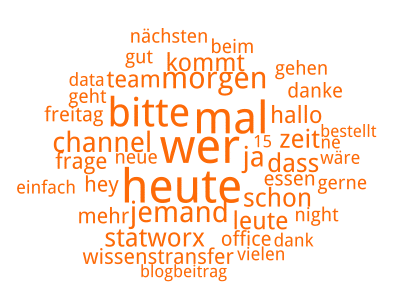
Seems that if we ask a question “heute wer mal bitte …” (“today someone please…”), we get a reaction – mostly positive.
The most common emojis
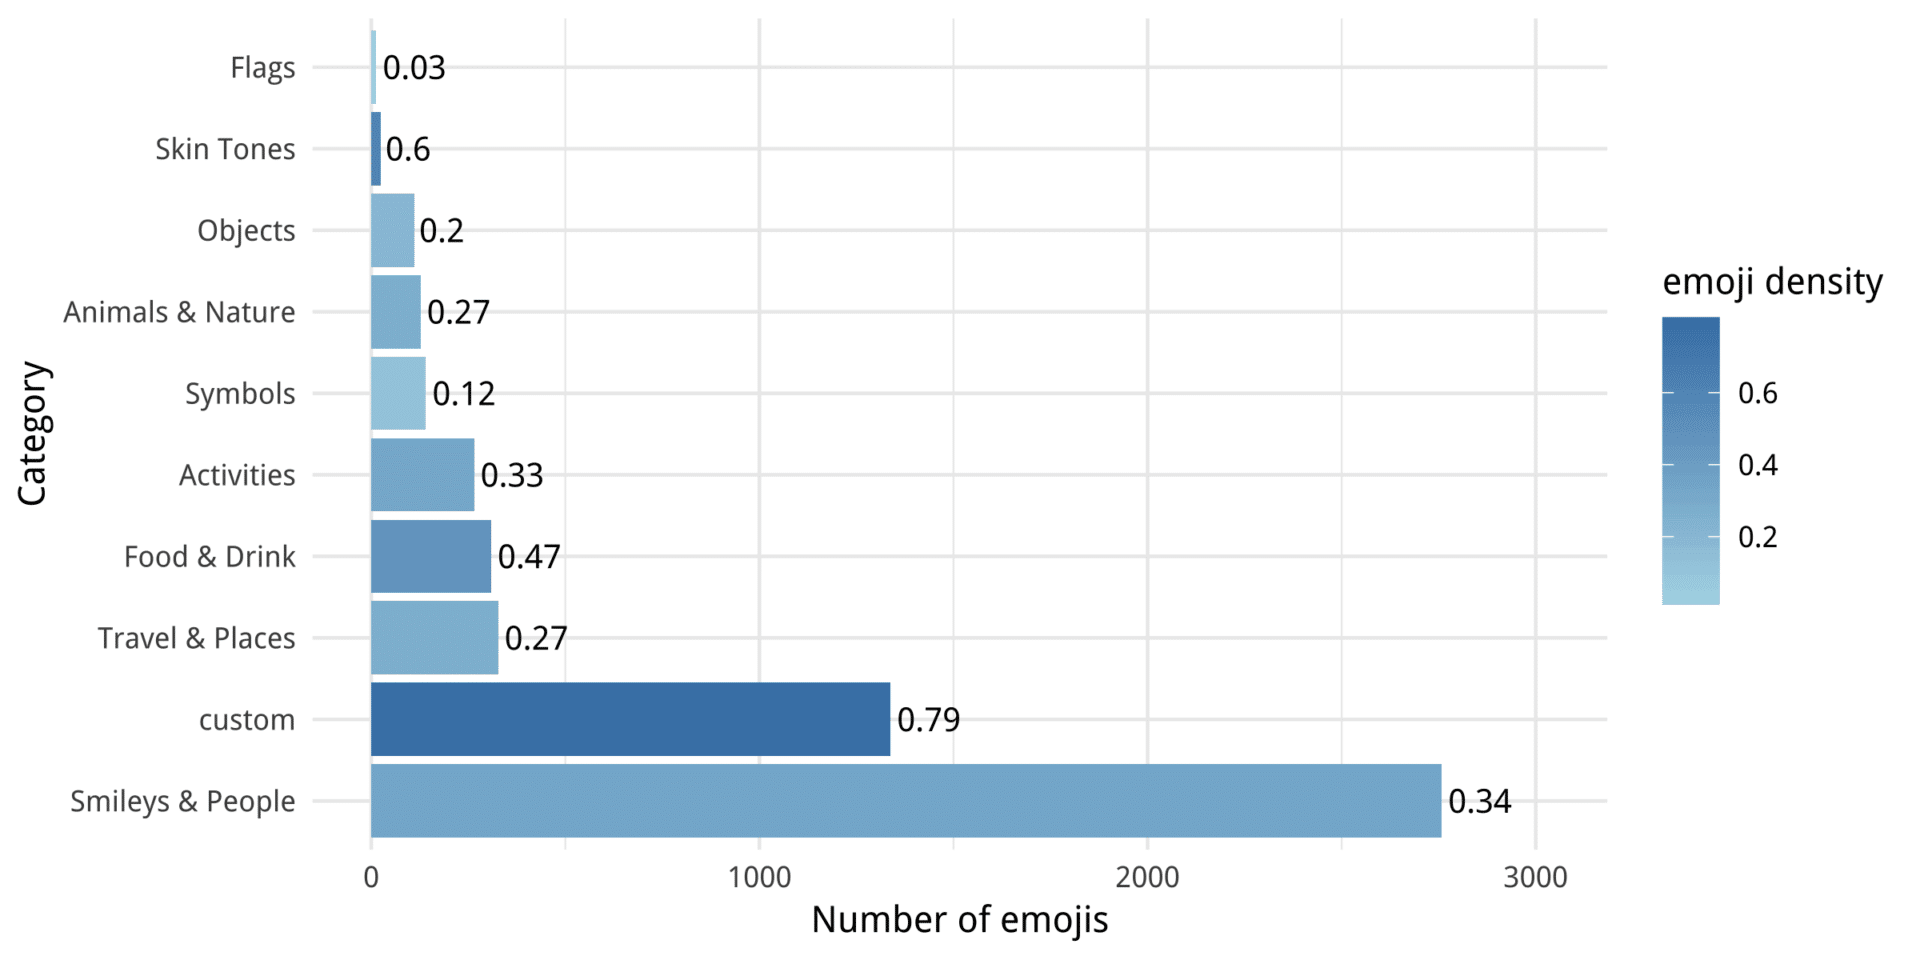
As we can see in the plot above, we use the emoji’s categories differently. First of all, Smileys and People are used the most. But if we look at the emoji density – which represents the percentage of unique used emoji within this category – we only use a third of them. On the other hand, nearly 80% of our custom emojis were used.
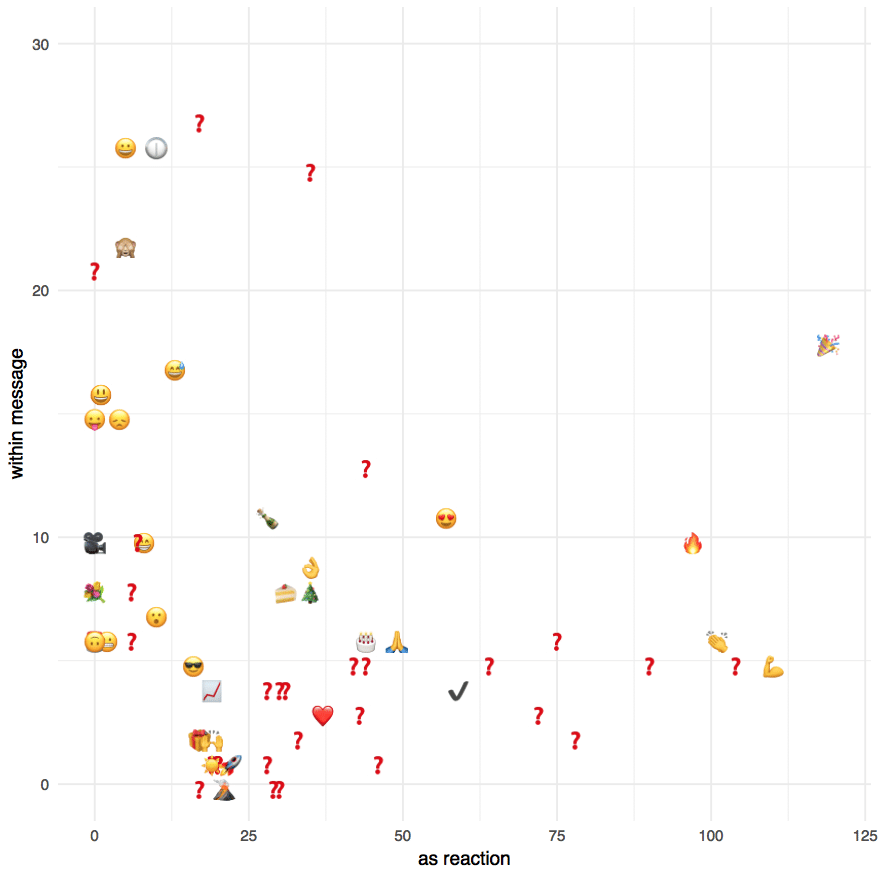
To find the most commonly used emojis I looked at the top 50 emojis within messages and reactions. Also, I stumbled upon two R packages (emoGG and emojifont) which let you add emojis to your ggplots. This sounded wonderful, but there was a catch! Since we work with RStudio on a Mac I could not use the RStudio plotting device, since it would not show the emojis. After a little bit of research, I found this post here, which suggested to use quartz() and grid.export with .svg for the plotting. The loaded font obviously did not have our own emojis, so I just added them as❓.
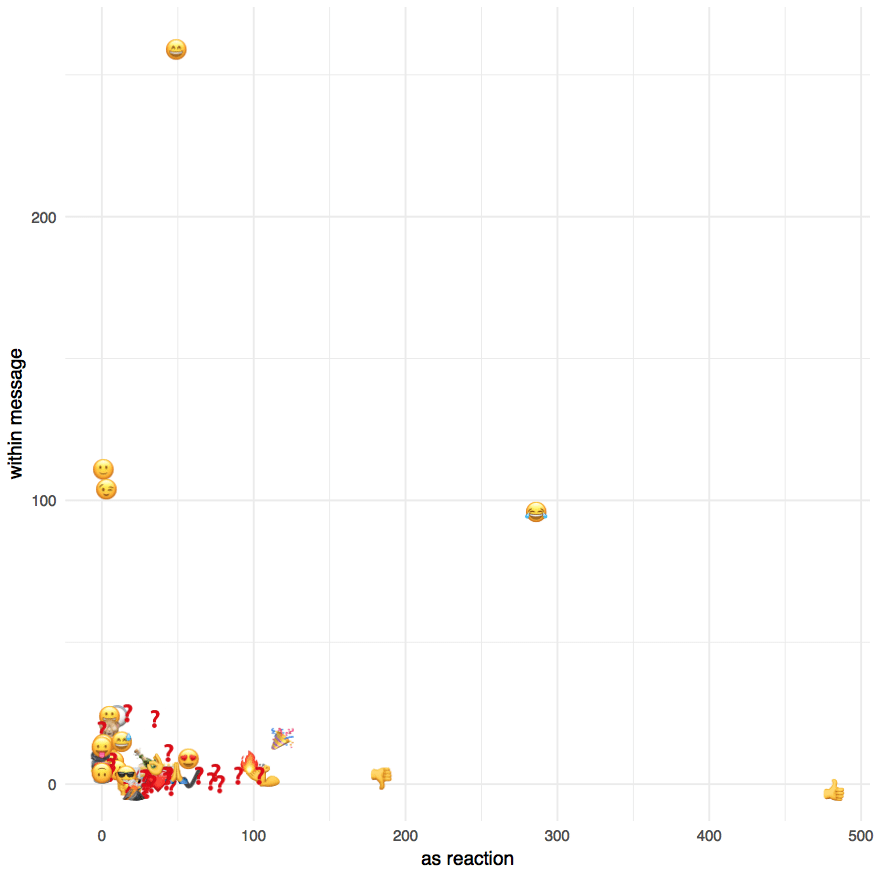
So, as I thought in the beginning our top emoji is ????, followed by ???? and ????.
| Emoji | message | as reaction | total |
|---|---|---|---|
| ???? | 0 | 482 | 482 |
| ???? | 98 | 281 | 379 |
| ???? | 260 | 49 | 309 |
But since there is a lot going on in the lower-left corner – let’s have a closer look! We can see a variety of emojis being used with a lot of custom ones.
With this package, we can also update the plot showing our daily usage with the most commonly used one at the time.
![]()
Conclusion
With this little project, I just scratched the surface of possibilities to analyze the usage of emojis. If you have more ideas, I would like to see your approach and solutions. Just send me an email at blog@statworx.com. To get started you can use my code at our GitHub – not containing our whole data of course, but with an example folder with two jsons. Here you can add your own Slack history.
References
- list of emojis
https://raw.githubusercontent.com/iamcal/emoji-data/master/categories.json - emojifont package
https://mran.microsoft.com/snapshot/2016-07-03/web/packages/emojifont/vignettes/emojifont.html - emoGG package
https://github.com/dill/emoGG